Honeywell 2010 Annual Report Download - page 101
Download and view the complete annual report
Please find page 101 of the 2010 Honeywell annual report below. You can navigate through the pages in the report by either clicking on the pages listed below, or by using the keyword search tool below to find specific information within the annual report.-
 1
1 -
2
-
3
-
4
-
5
-
6
-
7
-
8
-
9
-
10
-
11
-
12
-
13
-
14
-
15
-
16
-
17
-
18
-
19
-
20
-
21
-
22
-
23
-
24
-
25
-
26
-
27
-
28
-
29
-
30
-
31
-
32
-
33
-
34
-
35
-
36
-
37
-
38
-
39
-
40
-
41
-
42
-
43
-
44
-
45
-
46
-
47
-
48
-
49
-
50
-
51
-
52
-
53
-
54
-
55
-
56
-
57
-
58
-
59
-
60
-
61
-
62
-
63
-
64
-
65
-
66
-
67
-
68
-
69
-
70
-
71
-
72
-
73
-
74
-
75
-
76
-
77
-
78
-
79
-
80
-
81
-
82
-
83
-
84
-
85
-
86
-
87
-
88
-
89
-
90
-
 91
91 -
 92
92 -
 93
93 -
 94
94 -
 95
95 -
 96
96 -
 97
97 -
 98
98 -
 99
99 -
 100
100 -
 101
101 -
 102
102 -
 103
103 -
 104
104 -
 105
105 -
 106
106 -
 107
107 -
 108
108 -
 109
109 -
 110
110 -
 111
111 -
112
-
113
-
114
-
115
-
116
-
117
-
118
-
119
-
120
-
121
-
122
-
123
-
124
-
125
-
126
-
127
-
128
-
129
-
130
-
131
-
132
-
133
-
134
-
135
-
136
-
137
-
138
-
139
-
140
-
141
-
142
-
143
-
144
-
145
-
146
-
147
-
148
-
149
-
150
-
151
-
152
-
153
-
154
-
155
-
156
-
157
-
158
-
159
-
160
-
161
-
162
-
163
-
164
-
165
-
166
-
167
-
168
-
169
-
170
-
171
-
172
-
173
-
174
-
175
-
176
-
177
-
178
-
179
-
180
-
181
-
182
-
183
 |
 |

HONEYWELL INTERNATIONAL INC.
NOTES TO FINANCIAL STATEMENTS—(Continued)
(Dollars in millions, except per share amounts)
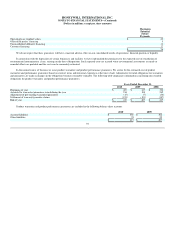
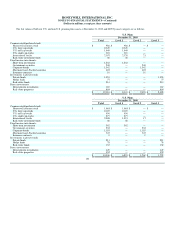
Pension Benefits
U.S. Plans Non-U.S. Plans
Net periodic benefit cost 2010 2009 2008 2010 2009 2008
Service cost $ 221 $ 183 $ 198 $ 51 $ 41 $ 57
Interest cost 768 785 765 228 208 244
Expected return on plan assets (902) (767) (1,140) (248) (221) (301)
Amortization of transition
(asset) obligation — — — 1 1 1
Amortization of prior service
cost (credit) 32 26 30 (1) (1) (1)
Recognition of actuarial losses 182 447 3,192 289 308 112
Settlements and curtailments — — — 4 — 18
Net periodic benefit cost $ 301 $ 674 $ 3,045 $ 324 $ 336 $ 130
Other Changes in Plan Assets and
Benefits Obligations Recognized in
Other Comprehensive (Income) Loss
U.S. Plans Non-U.S. Plans
2010 2009 2008 2010 2009 2008
Actuarial (gains)/losses $ 325 $ 686 $ 4,432 $ (20) $ 449 $ 311
Prior service cost (credit) 117 — 27 — 2 —
Transition (asset) obligation
recognized during year — — — (1) (1) (1)
Prior service (cost) credit
recognized during year (32) (26) (30) 1 1 —
Actuarial losses recognized
during year (182) (447) (3,192) (289) (308) (129)
Foreign exchange translation
adjustments — — — (17) 42 (54)
Total recognized in other
comprehensive (income) loss $ 228 $ 213 $ 1,237 $ (326) $ 185 $ 127
Total Recognized in net periodic
benefit costs and other
comprehensive (income) loss $ 529 $ 887 $ 4,282 $ (2) $ 521 $ 257
The estimated prior service cost for pension benefits that will be amortized from accumulated other comprehensive (income) loss into net periodic
benefit cost in 2011 are expected to be $33 million and $(2) million for U.S. and Non-U.S. benefit plans, respectively.
98