Honeywell 2010 Annual Report Download - page 88
Download and view the complete annual report
Please find page 88 of the 2010 Honeywell annual report below. You can navigate through the pages in the report by either clicking on the pages listed below, or by using the keyword search tool below to find specific information within the annual report.-
 1
1 -
2
-
3
-
4
-
5
-
6
-
7
-
8
-
9
-
10
-
11
-
12
-
13
-
14
-
15
-
16
-
17
-
18
-
19
-
20
-
21
-
22
-
23
-
24
-
25
-
26
-
27
-
28
-
29
-
30
-
31
-
32
-
33
-
34
-
35
-
36
-
37
-
38
-
39
-
40
-
41
-
42
-
43
-
44
-
45
-
46
-
47
-
48
-
49
-
50
-
51
-
52
-
53
-
54
-
55
-
56
-
57
-
58
-
59
-
60
-
61
-
62
-
63
-
64
-
65
-
66
-
67
-
68
-
69
-
70
-
71
-
72
-
73
-
74
-
75
-
76
-
77
-
 78
78 -
 79
79 -
 80
80 -
 81
81 -
 82
82 -
 83
83 -
 84
84 -
 85
85 -
 86
86 -
 87
87 -
 88
88 -
 89
89 -
 90
90 -
 91
91 -
 92
92 -
 93
93 -
 94
94 -
 95
95 -
 96
96 -
 97
97 -
 98
98 -
99
-
100
-
101
-
102
-
103
-
104
-
105
-
106
-
107
-
108
-
109
-
110
-
111
-
112
-
113
-
114
-
115
-
116
-
117
-
118
-
119
-
120
-
121
-
122
-
123
-
124
-
125
-
126
-
127
-
128
-
129
-
130
-
131
-
132
-
133
-
134
-
135
-
136
-
137
-
138
-
139
-
140
-
141
-
142
-
143
-
144
-
145
-
146
-
147
-
148
-
149
-
150
-
151
-
152
-
153
-
154
-
155
-
156
-
157
-
158
-
159
-
160
-
161
-
162
-
163
-
164
-
165
-
166
-
167
-
168
-
169
-
170
-
171
-
172
-
173
-
174
-
175
-
176
-
177
-
178
-
179
-
180
-
181
-
182
-
183
 |
 |

HONEYWELL INTERNATIONAL INC.
NOTES TO FINANCIAL STATEMENTS—(Continued)
(Dollars in millions, except per share amounts)
Options Outstanding Options Exercisable
Range of
Exercise prices Number
Outstanding
Weighted
Average
Life(1)
Weighted
Average
Exercise
Price
Aggregate
Intrinsic
Value Number
Exercisable
Weighted
Average
Exercise
Price
Aggregate
Intrinsic
Value
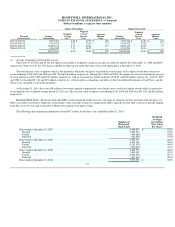
$21.75–$32.99 9,715,402 6.87 $ 27.55 $ 249 3,865,364 $ 26.26 $ 104
$33.00–$39.99 9,924,474 2.92 35.92 171 9,924,474 35.92 171
$40.00–$49.99 16,890,135 7.13 42.66 177 8,539,435 44.20 77
$50.00–$74.95 4,261,520 7.13 58.25 — 2,393,220 58.16 —
40,791,531 6.05 39.05 $ 597 24,722,493 39.43 $ 352
(1) Average remaining contractual life in years.
There were 27,427,023 and 30,314,667 options exercisable at weighted average exercise prices of $38.85 and $41.40 at December 31, 2009 and 2008,
respectively. There were 21,512,252 shares available for future grants under the terms of our stock option plans at December 31, 2010.
The total intrinsic value of options (which is the amount by which the stock price exceeded the exercise price of the options on the date of exercise)
exercised during 2010, 2009 and 2008 was $54, $4 and $76 million, respectively. During 2010, 2009 and 2008, the amount of cash received from the exercise
of stock options was $181, $20 and $134 million, respectively, with an associated tax benefit realized of $18, $1 and $28 million, respectively. In 2010, 2009
and 2008 we classified $13, $1 and $21 million, respectively, of this benefit as a financing cash inflow in the Consolidated Statement of Cash Flows, and the
balance was classified as cash from operations.
At December 31, 2010, there was $94 million of total unrecognized compensation cost related to non-vested stock option awards which is expected to
be recognized over a weighted-average period of 2.43 years. The total fair value of options vested during 2010, 2009 and 2008 was $41, $51 and $63 million,
respectively.
Restricted Stock Units—Restricted stock unit (RSU) awards entitle the holder to receive one share of common stock for each unit when the units vest.
RSUs are issued to certain key employees at fair market value at the date of grant as compensation. RSUs typically become fully vested over periods ranging
from three to seven years and are payable in Honeywell common stock upon vesting.
The following table summarizes information about RSU activity for the three years ended December 31, 2010:
Number of
Restricted
Stock Units
Weighted
Average
Grant Date
Fair Value
Per Share
Non-vested at December 31, 2007 5,856,997 $ 42.18
Granted 2,087,934 54.56
Vested (694,660) 35.82
Forfeited (424,554) 41.94
Non-vested at December 31, 2008 6,825,717 46.63
Granted 3,691,129 30.16
Vested (1,313,975) 40.44
Forfeited (940,094) 44.51
Non-vested at December 31, 2009 8,262,777 40.49
Granted 3,842,367 42.33
Vested (1,593,979) 48.71
Forfeited (537,212) 40.45
Non-vested at December 31, 2010 9,973,953 $ 39.89
85