Honeywell 2010 Annual Report Download - page 62
Download and view the complete annual report
Please find page 62 of the 2010 Honeywell annual report below. You can navigate through the pages in the report by either clicking on the pages listed below, or by using the keyword search tool below to find specific information within the annual report.-
 1
1 -
2
-
3
-
4
-
5
-
6
-
7
-
8
-
9
-
10
-
11
-
12
-
13
-
14
-
15
-
16
-
17
-
18
-
19
-
20
-
21
-
22
-
23
-
24
-
25
-
26
-
27
-
28
-
29
-
30
-
31
-
32
-
33
-
34
-
35
-
36
-
37
-
38
-
39
-
40
-
41
-
42
-
43
-
44
-
45
-
46
-
47
-
48
-
49
-
50
-
51
-
 52
52 -
 53
53 -
 54
54 -
 55
55 -
 56
56 -
 57
57 -
 58
58 -
 59
59 -
 60
60 -
 61
61 -
 62
62 -
 63
63 -
 64
64 -
 65
65 -
 66
66 -
 67
67 -
 68
68 -
 69
69 -
 70
70 -
 71
71 -
 72
72 -
73
-
74
-
75
-
76
-
77
-
78
-
79
-
80
-
81
-
82
-
83
-
84
-
85
-
86
-
87
-
88
-
89
-
90
-
91
-
92
-
93
-
94
-
95
-
96
-
97
-
98
-
99
-
100
-
101
-
102
-
103
-
104
-
105
-
106
-
107
-
108
-
109
-
110
-
111
-
112
-
113
-
114
-
115
-
116
-
117
-
118
-
119
-
120
-
121
-
122
-
123
-
124
-
125
-
126
-
127
-
128
-
129
-
130
-
131
-
132
-
133
-
134
-
135
-
136
-
137
-
138
-
139
-
140
-
141
-
142
-
143
-
144
-
145
-
146
-
147
-
148
-
149
-
150
-
151
-
152
-
153
-
154
-
155
-
156
-
157
-
158
-
159
-
160
-
161
-
162
-
163
-
164
-
165
-
166
-
167
-
168
-
169
-
170
-
171
-
172
-
173
-
174
-
175
-
176
-
177
-
178
-
179
-
180
-
181
-
182
-
183
 |
 |

HONEYWELL INTERNATIONAL INC.
NOTES TO FINANCIAL STATEMENTS—(Continued)
(Dollars in millions, except per share amounts)
as appropriate. For aircraft manufacturers, incentives are recorded when the products are delivered; for airlines, incentives are recorded when the associated
aircraft are delivered by the aircraft manufacturer to the airline.
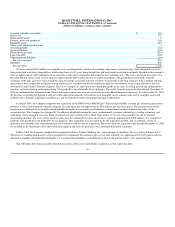
Research and Development—Research and development costs for company-sponsored research and development projects are expensed as incurred.
Such costs are principally included in Cost of Products Sold and were $1,466, $1,330 and $1,543 million in 2010, 2009 and 2008, respectively.
Stock-Based Compensation Plans—The principal awards issued under our stock-based compensation plans, which are described in Note 20, include
non-qualified stock options and restricted stock units (RSUs). The cost for such awards is measured at the grant date based on the fair value of the award. The
value of the portion of the award that is ultimately expected to vest is recognized as expense over the requisite service periods (generally the vesting period of
the equity award) and is included in selling, general and administrative expense in our Consolidated Statement of Operations. Forfeitures are required to be
estimated at the time of grant in order to estimate the portion of the award that will ultimately vest. The estimate is based on our historical rates of forfeiture.
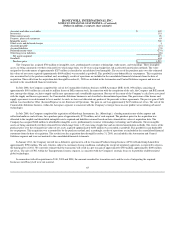
Pension and Other Postretirement Benefits— We sponsor both funded and unfunded U.S. and non-U.S. defined benefit pension plans covering the
majority of our employees and retirees. We also sponsor postretirement benefit plans that provide health care benefits and life insurance coverage to eligible
retirees.
In 2010 we elected to change our method of recognizing pension expense. Previously, for our U.S. defined benefit pension plans we used the market-
related value of plan assets reflecting changes in the fair value of plan assets over a three-year period and net actuarial gains or losses in excess of 10 percent
of the greater of the market-related value of plan assets or the plans' projected benefit obligation (the corridor) were recognized over a six-year period. Under
our new accounting method, we recognize changes in the fair value of plan assets and net actuarial gains or losses in excess of the corridor annually in the
fourth quarter each year (MTM Adjustment). The remaining components of pension expense, primarily service and interest costs and assumed return on plan
assets, will be recorded on a quarterly basis (On-going Pension Expense). While the historical policy of recognizing pension expense was considered
acceptable, we believe that the new policy is preferable as it eliminates the delay in recognition of actuarial gains and losses outside the corridor.
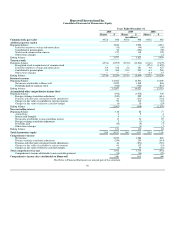
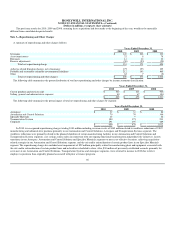
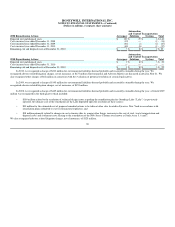
This change has been reported through retrospective application of the new policy to all periods presented. The impacts of all adjustments made to the
financial statements are summarized below:
Consolidated Statement of Operations
Year Ended December 31, 2009
Previously
Reported Revised
Effect of
Change
Cost of products sold 18,637 19,317 680
Cost of services sold 4,548 4,695 147
Selling, general and administrative expenses 4,341 4,443 102
Income before taxes 2,978 2,049 (929)
Tax expense 789 465 (324)
Net income 2,189 1,584 (605)
Net income attributable to Honeywell 2,153 1,548 (605)
Earnings per share of common stock-basic 2.86 2.06 (0.80)
Earnings per share of common stock-assuming dilution 2.85 2.05 (0.80)
59