Honeywell 2010 Annual Report Download - page 49
Download and view the complete annual report
Please find page 49 of the 2010 Honeywell annual report below. You can navigate through the pages in the report by either clicking on the pages listed below, or by using the keyword search tool below to find specific information within the annual report.-
 1
1 -
2
-
3
-
4
-
5
-
6
-
7
-
8
-
9
-
10
-
11
-
12
-
13
-
14
-
15
-
16
-
17
-
18
-
19
-
20
-
21
-
22
-
23
-
24
-
25
-
26
-
27
-
28
-
29
-
30
-
31
-
32
-
33
-
34
-
35
-
36
-
37
-
38
-
 39
39 -
 40
40 -
 41
41 -
 42
42 -
 43
43 -
 44
44 -
 45
45 -
 46
46 -
 47
47 -
 48
48 -
 49
49 -
 50
50 -
 51
51 -
 52
52 -
 53
53 -
 54
54 -
 55
55 -
 56
56 -
 57
57 -
 58
58 -
 59
59 -
60
-
61
-
62
-
63
-
64
-
65
-
66
-
67
-
68
-
69
-
70
-
71
-
72
-
73
-
74
-
75
-
76
-
77
-
78
-
79
-
80
-
81
-
82
-
83
-
84
-
85
-
86
-
87
-
88
-
89
-
90
-
91
-
92
-
93
-
94
-
95
-
96
-
97
-
98
-
99
-
100
-
101
-
102
-
103
-
104
-
105
-
106
-
107
-
108
-
109
-
110
-
111
-
112
-
113
-
114
-
115
-
116
-
117
-
118
-
119
-
120
-
121
-
122
-
123
-
124
-
125
-
126
-
127
-
128
-
129
-
130
-
131
-
132
-
133
-
134
-
135
-
136
-
137
-
138
-
139
-
140
-
141
-
142
-
143
-
144
-
145
-
146
-
147
-
148
-
149
-
150
-
151
-
152
-
153
-
154
-
155
-
156
-
157
-
158
-
159
-
160
-
161
-
162
-
163
-
164
-
165
-
166
-
167
-
168
-
169
-
170
-
171
-
172
-
173
-
174
-
175
-
176
-
177
-
178
-
179
-
180
-
181
-
182
-
183
 |
 |

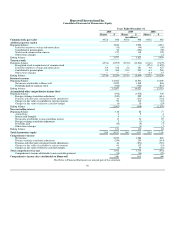
The following table illustrates the potential change in fair value for interest rate sensitive instruments based on a hypothetical immediate one-
percentage-point increase in interest rates across all maturities, the potential change in fair value for foreign exchange rate sensitive instruments based on a 10
percent weakening of the U.S. dollar versus local currency exchange rates across all maturities, and the potential change in fair value of contracts hedging
commodity purchases based on a 20 percent decrease in the price of the underlying commodity across all maturities at December 31, 2010 and 2009.
Face or
Notional
Amount
Carrying
Value(1)
Fair
Value(1)
Estimated
Increase
(Decrease)
in Fair
Value
December 31, 2010
Interest Rate Sensitive Instruments
Long-term debt (including current maturities) $ 6,278 $ (6,278) $ (6,835) $ (399)
Interest rate swap agreements 600 22 22 (18)
Foreign Exchange Rate Sensitive Instruments
Foreign currency exchange contracts(2) 5,733 2 2 102
Commodity Price Sensitive Instruments
Forward commodity contracts(3) 23 — — (4)
December 31, 2009
Interest Rate Sensitive Instruments
Long-term debt (including current maturities) $ 7,264 $ (7,264) $ (7,677) $ (421)
Interest rate swap agreements 600 (2) (2) (23)
Foreign Exchange Rate Sensitive Instruments
Foreign currency exchange contracts(2) 2,959 8 8 79
Commodity Price Sensitive Instruments
Forward commodity contracts(3) 52 4 4 (10)
(1) Asset or (liability).
(2) Changes in the fair value of foreign currency exchange contracts are offset by changes in the fair value or cash flows of underlying hedged foreign
currency transactions.
(3) Changes in the fair value of forward commodity contracts are offset by changes in the cash flows of underlying hedged commodity transactions.
The above discussion of our procedures to monitor market risk and the estimated changes in fair value resulting from our sensitivity analyses are
forward-looking statements of market risk assuming certain adverse market conditions occur. Actual results in the future may differ materially from these
estimated results due to actual developments in the global financial markets. The methods used by us to assess and mitigate risk discussed above should not be
considered projections of future events.
46