Honeywell 2010 Annual Report Download - page 38
Download and view the complete annual report
Please find page 38 of the 2010 Honeywell annual report below. You can navigate through the pages in the report by either clicking on the pages listed below, or by using the keyword search tool below to find specific information within the annual report.-
 1
1 -
2
-
3
-
4
-
5
-
6
-
7
-
8
-
9
-
10
-
11
-
12
-
13
-
14
-
15
-
16
-
17
-
18
-
19
-
20
-
21
-
22
-
23
-
24
-
25
-
26
-
27
-
 28
28 -
 29
29 -
 30
30 -
 31
31 -
 32
32 -
 33
33 -
 34
34 -
 35
35 -
 36
36 -
 37
37 -
 38
38 -
 39
39 -
 40
40 -
 41
41 -
 42
42 -
 43
43 -
 44
44 -
 45
45 -
 46
46 -
 47
47 -
 48
48 -
49
-
50
-
51
-
52
-
53
-
54
-
55
-
56
-
57
-
58
-
59
-
60
-
61
-
62
-
63
-
64
-
65
-
66
-
67
-
68
-
69
-
70
-
71
-
72
-
73
-
74
-
75
-
76
-
77
-
78
-
79
-
80
-
81
-
82
-
83
-
84
-
85
-
86
-
87
-
88
-
89
-
90
-
91
-
92
-
93
-
94
-
95
-
96
-
97
-
98
-
99
-
100
-
101
-
102
-
103
-
104
-
105
-
106
-
107
-
108
-
109
-
110
-
111
-
112
-
113
-
114
-
115
-
116
-
117
-
118
-
119
-
120
-
121
-
122
-
123
-
124
-
125
-
126
-
127
-
128
-
129
-
130
-
131
-
132
-
133
-
134
-
135
-
136
-
137
-
138
-
139
-
140
-
141
-
142
-
143
-
144
-
145
-
146
-
147
-
148
-
149
-
150
-
151
-
152
-
153
-
154
-
155
-
156
-
157
-
158
-
159
-
160
-
161
-
162
-
163
-
164
-
165
-
166
-
167
-
168
-
169
-
170
-
171
-
172
-
173
-
174
-
175
-
176
-
177
-
178
-
179
-
180
-
181
-
182
-
183
 |
 |

• Global demand for commodities such as caprolactam and ammonium sulfate; and
• Increasing demand for renewable energy and biofuels.
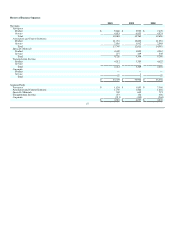
Specialty Materials
2010 2009 Change 2008 Change
Net sales $ 4,726 $ 4,144 14% $ 5,266 (21)%
Cost of products and services sold 3,554 3,127 4,121
Selling, general and administrative expenses 345 345 395
Other 78 67 29
Segment profit $ 749 $ 605 24% $ 721 (16)%
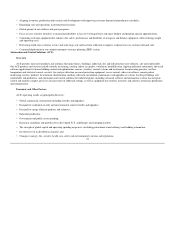
Factors Contributing to Year-Over-Year Change
2010 vs. 2009 2009 vs. 2008
Sales
Segment
Profit Sales
Segment
Profit
Organic growth/ Operational segment profit 14% 25% (20)% (14)%
Foreign exchange 0% (1)% (1)% (2)%
Total % Change 14% 24% (21)% (16)%
2010 compared with 2009
Specialty Materials sales increased by 14 percent in 2010 compared with 2009 predominantly due to organic growth.
• Advanced Materials sales increased by 23 percent in 2010 compared to 2009 primarily driven by (i) a 29 percent increase in Resins and
Chemicals sales primarily due to higher prices driven by strong Asia demand, formula pricing arrangements and agricultural demand, (ii) a 21
percent increase in Specialty Products sales most significantly due to higher sales volume to our semiconductor, specialty additives, advanced
fiber industrial applications and specialty chemicals customers, (iii) a 19 percent increase in our Fluorine Products business due to higher sales
volume from increased demand for our refrigerants, insulating materials and industrial processing aids.
• UOP sales decreased by 1 percent in 2010 compared to 2009 primarily driven by lower new unit catalyst sales and timing of projects activity in
the refining and petrochemical industries, partially offset by increased gas processing equipment sales.
Specialty Materials segment profit increased by 24 percent in 2010 compared with 2009 due to a 25 percent increase in operational segment profit. The
increase in operational segment profit is primarily due to a 24 percent positive impact from higher sales volumes. The positive impact from price and
productivity was offset by the negative impact from inflation (including the absence of prior period labor cost actions). Cost of goods sold totaled $3.6 billion
in 2010, an increase of approximately $400 million which is primarily as a result of the factors discussed above.
2009 compared with 2008
Specialty Materials sales decreased by 21 percent in 2009 compared with 2008 primarily driven by (i) a 32 percent decrease in Resins and Chemicals
sales due to substantial price declines arising from pass through of lower raw materials costs, partially offset by increased volume (most notably in the fourth
quarter), (ii) a 19 percent decrease in UOP sales due to customer deferrals of projects as a result of reduced demand for additional capacity in the refining and
petrochemical industries as well as lower catalyst sales, (iii) a 22 percent decrease in Specialty Products sales most significantly due to continued demand
softness across key customer end-markets, and (iv) an 11 percent decrease in Fluorine Products sales due to lower volume sales of refrigerants and insulating
materials principally driven by customer inventory reduction initiatives and soft construction and original equipment manufacturing end markets, partially
offset by price increases.
35