Honeywell 2010 Annual Report Download - page 41
Download and view the complete annual report
Please find page 41 of the 2010 Honeywell annual report below. You can navigate through the pages in the report by either clicking on the pages listed below, or by using the keyword search tool below to find specific information within the annual report.-
 1
1 -
2
-
3
-
4
-
5
-
6
-
7
-
8
-
9
-
10
-
11
-
12
-
13
-
14
-
15
-
16
-
17
-
18
-
19
-
20
-
21
-
22
-
23
-
24
-
25
-
26
-
27
-
28
-
29
-
30
-
 31
31 -
 32
32 -
 33
33 -
 34
34 -
 35
35 -
 36
36 -
 37
37 -
 38
38 -
 39
39 -
 40
40 -
 41
41 -
 42
42 -
 43
43 -
 44
44 -
 45
45 -
 46
46 -
 47
47 -
 48
48 -
 49
49 -
 50
50 -
 51
51 -
52
-
53
-
54
-
55
-
56
-
57
-
58
-
59
-
60
-
61
-
62
-
63
-
64
-
65
-
66
-
67
-
68
-
69
-
70
-
71
-
72
-
73
-
74
-
75
-
76
-
77
-
78
-
79
-
80
-
81
-
82
-
83
-
84
-
85
-
86
-
87
-
88
-
89
-
90
-
91
-
92
-
93
-
94
-
95
-
96
-
97
-
98
-
99
-
100
-
101
-
102
-
103
-
104
-
105
-
106
-
107
-
108
-
109
-
110
-
111
-
112
-
113
-
114
-
115
-
116
-
117
-
118
-
119
-
120
-
121
-
122
-
123
-
124
-
125
-
126
-
127
-
128
-
129
-
130
-
131
-
132
-
133
-
134
-
135
-
136
-
137
-
138
-
139
-
140
-
141
-
142
-
143
-
144
-
145
-
146
-
147
-
148
-
149
-
150
-
151
-
152
-
153
-
154
-
155
-
156
-
157
-
158
-
159
-
160
-
161
-
162
-
163
-
164
-
165
-
166
-
167
-
168
-
169
-
170
-
171
-
172
-
173
-
174
-
175
-
176
-
177
-
178
-
179
-
180
-
181
-
182
-
183
 |
 |

quarter of 2009 these factors and increased Turbo Technologies volumes resulted in a $66 million increase in Transportation Systems' segment profit.
2011 Areas of Focus
Transportation Systems primary areas of focus in 2011 include:
• Sustaining superior turbocharger technology through successful platform launches;
• Maintaining the high quality of current products while executing new product introductions;
• Increasing global penetration and share of diesel and gasoline turbocharger OEM demand;
• Increasing plant productivity to address capacity challenges generated by volatility in product demand and OEM inventory levels;
• Aligning cost structure with current economic outlook, and successful execution of repositioning actions; and
• Aligning development efforts and costs with new turbo platform launch schedules.
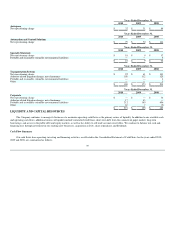
Repositioning and Other Charges
See Note 3 to the financial statements for a discussion of repositioning and other charges incurred in 2010, 2009, and 2008. Our repositioning actions
are expected to generate incremental pretax savings of approximately $200 million in 2011 compared with 2010 principally from planned workforce
reductions. Cash expenditures for severance and other exit costs necessary to execute our repositioning actions were $151, $200, and $157 million in 2010,
2009, and 2008, respectively. Such expenditures for severance and other exit costs have been funded principally through operating cash flows. Cash
expenditures for severance and other costs necessary to execute the remaining actions will approximate a total of $150 million in 2011 and will be funded
through operating cash flows.
The following tables provide details of the pretax impact of total net repositioning and other charges by segment.
38