Honeywell 2010 Annual Report Download - page 37
Download and view the complete annual report
Please find page 37 of the 2010 Honeywell annual report below. You can navigate through the pages in the report by either clicking on the pages listed below, or by using the keyword search tool below to find specific information within the annual report.-
 1
1 -
2
-
3
-
4
-
5
-
6
-
7
-
8
-
9
-
10
-
11
-
12
-
13
-
14
-
15
-
16
-
17
-
18
-
19
-
20
-
21
-
22
-
23
-
24
-
25
-
26
-
 27
27 -
 28
28 -
 29
29 -
 30
30 -
 31
31 -
 32
32 -
 33
33 -
 34
34 -
 35
35 -
 36
36 -
 37
37 -
 38
38 -
 39
39 -
 40
40 -
 41
41 -
 42
42 -
 43
43 -
 44
44 -
 45
45 -
 46
46 -
 47
47 -
48
-
49
-
50
-
51
-
52
-
53
-
54
-
55
-
56
-
57
-
58
-
59
-
60
-
61
-
62
-
63
-
64
-
65
-
66
-
67
-
68
-
69
-
70
-
71
-
72
-
73
-
74
-
75
-
76
-
77
-
78
-
79
-
80
-
81
-
82
-
83
-
84
-
85
-
86
-
87
-
88
-
89
-
90
-
91
-
92
-
93
-
94
-
95
-
96
-
97
-
98
-
99
-
100
-
101
-
102
-
103
-
104
-
105
-
106
-
107
-
108
-
109
-
110
-
111
-
112
-
113
-
114
-
115
-
116
-
117
-
118
-
119
-
120
-
121
-
122
-
123
-
124
-
125
-
126
-
127
-
128
-
129
-
130
-
131
-
132
-
133
-
134
-
135
-
136
-
137
-
138
-
139
-
140
-
141
-
142
-
143
-
144
-
145
-
146
-
147
-
148
-
149
-
150
-
151
-
152
-
153
-
154
-
155
-
156
-
157
-
158
-
159
-
160
-
161
-
162
-
163
-
164
-
165
-
166
-
167
-
168
-
169
-
170
-
171
-
172
-
173
-
174
-
175
-
176
-
177
-
178
-
179
-
180
-
181
-
182
-
183
 |
 |

deferral of capital and operating expenditures. Orders decreased while backlog increased in 2009. Decreased orders are primarily due to the
unfavorable impact of foreign exchange, softening demand (as noted above) and order timing and delays. Higher backlog is primarily due to
longer duration projects. The impact of these factors was partially offset by the positive impact of acquisitions, most significantly the RMG
Group.
ACS segment profit decreased by 2 percent in 2009 compared with 2008 principally due to the negative impact of lower sales as a result of the factors
discussed above and inflation, partially offset by lower material costs, reduced labor costs (reflecting reduced census, work schedule reductions, benefits from
prior repositioning actions and lower incentive compensation) and the positive impact of indirect cost savings initiatives. In the fourth quarter of 2009 these
factors more than offset the impact of lower sales described above resulting in a 5 percent increase in segment profit.
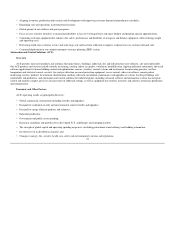
2011 Areas of Focus
ACS's primary areas of focus for 2011 include:
• Products and solutions for energy efficiency and asset management;
• Extending technology leadership: lowest total installed cost and integrated product solutions;
• Defending and extending our installed base through customer productivity and globalization;
• Sustaining strong brand recognition through our brand and channel management;
• Continued centralization and standardization of global software development capabilities;
• Continuing to identify, execute and integrate acquisitions in or adjacent to the markets which we serve;
• Continuing to establish and grow emerging markets presence and capability;
• Continuing to invest in new product development and introductions; and
• Continued deployment of our common ERP system.
Specialty Materials
Overview
Specialty Materials develops and manufactures high-purity, high-quality and high-performance chemicals and materials for applications in the refining,
petrochemical, automotive, healthcare, agricultural, packaging, refrigeration, appliance, housing, semiconductor, wax and adhesives segments. Specialty
Materials also provides process technology, products and services for the petroleum refining, gas processing, petrochemical, renewable energy and other
industries. Specialty Materials' product portfolio includes fluorocarbons, hydrofluoroolefins, caprolactam, resins, ammonium sulfate for fertilizer, specialty
films, waxes, additives, advanced fibers, customized research chemicals and intermediates, electronic materials and chemicals, catalysts, and adsorbents.
Economic and Other Factors
Specialty Materials operating results are principally driven by:
• Level and timing of capital spending and capacity and utilization rates in refining and petrochemical end markets;
• Degree of pricing volatility in raw materials such as benzene (the key component in phenol), fluorspar, natural gas, ethylene and sulfur;
• Impact of environmental and energy efficiency regulations;
• Extent of change in order rates from global semiconductor customers;
• Global demand for non-ozone depleting Hydro fluorocarbons (HFC's);
• Condition of the U.S. residential housing and non residential industries and automotive demand;
34