Honeywell 2010 Annual Report Download - page 24
Download and view the complete annual report
Please find page 24 of the 2010 Honeywell annual report below. You can navigate through the pages in the report by either clicking on the pages listed below, or by using the keyword search tool below to find specific information within the annual report.-
 1
1 -
2
-
3
-
4
-
5
-
6
-
7
-
8
-
9
-
10
-
11
-
12
-
13
-
 14
14 -
 15
15 -
 16
16 -
 17
17 -
 18
18 -
 19
19 -
 20
20 -
 21
21 -
 22
22 -
 23
23 -
 24
24 -
 25
25 -
 26
26 -
 27
27 -
 28
28 -
 29
29 -
 30
30 -
 31
31 -
 32
32 -
 33
33 -
 34
34 -
35
-
36
-
37
-
38
-
39
-
40
-
41
-
42
-
43
-
44
-
45
-
46
-
47
-
48
-
49
-
50
-
51
-
52
-
53
-
54
-
55
-
56
-
57
-
58
-
59
-
60
-
61
-
62
-
63
-
64
-
65
-
66
-
67
-
68
-
69
-
70
-
71
-
72
-
73
-
74
-
75
-
76
-
77
-
78
-
79
-
80
-
81
-
82
-
83
-
84
-
85
-
86
-
87
-
88
-
89
-
90
-
91
-
92
-
93
-
94
-
95
-
96
-
97
-
98
-
99
-
100
-
101
-
102
-
103
-
104
-
105
-
106
-
107
-
108
-
109
-
110
-
111
-
112
-
113
-
114
-
115
-
116
-
117
-
118
-
119
-
120
-
121
-
122
-
123
-
124
-
125
-
126
-
127
-
128
-
129
-
130
-
131
-
132
-
133
-
134
-
135
-
136
-
137
-
138
-
139
-
140
-
141
-
142
-
143
-
144
-
145
-
146
-
147
-
148
-
149
-
150
-
151
-
152
-
153
-
154
-
155
-
156
-
157
-
158
-
159
-
160
-
161
-
162
-
163
-
164
-
165
-
166
-
167
-
168
-
169
-
170
-
171
-
172
-
173
-
174
-
175
-
176
-
177
-
178
-
179
-
180
-
181
-
182
-
183
 |
 |

Part II.
Item 5. Market for Registrant's Common Equity, Related Stockholder Matters and Issuer Purchases of Equity Securities
Market and dividend information for Honeywell's common stock is included in Note 26 of Notes to Financial Statements in "Item 8. Financial
Statements and Supplementary Data."
The number of record holders of our common stock at December 31, 2010 was 61,830.
Honeywell did not purchase any of its common stock, par value $1 per share, for the year ending December 31, 2010. The Board of Directors has
authorized the repurchase of up to a total of $3 billion of Honeywell common stock, which amount includes $1.3 billion that remained available under the
Company's previously reported share repurchase program. Honeywell presently expects to repurchase outstanding shares from time to time during 2011 to
offset the dilutive impact of employee stock based compensation plans, including future option exercises, restricted unit vesting and matching contributions
under our savings plans. The amount and timing of future repurchases may vary depending on market conditions and the level of operating, financing and
other investing activities.
Performance Graph
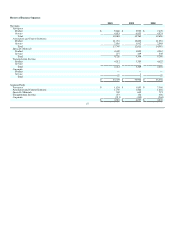
The following graph compares the five-year cumulative total return on our Common Stock to the total returns on the Standard & Poor's 500 Stock Index
and a composite of Standard & Poor's Industrial Conglomerates and Aerospace and Defense indices, on a 60%/40% weighted basis, respectively (the
"Composite Index"). The weighting of the components of the Composite Index are based on our segments' relative contribution to total segment profit. In
prior years, these components had been equally weighted. The change in weighting reflects the growth, both organic and through acquisitions, in the
Company's non-Aerospace businesses. The selection of the Industrial Conglomerates component of the Composite Index reflects the diverse and distinct
range of non-aerospace businesses conducted by Honeywell. Per SEC rules, we are including the Composite Index on an equally weighted basis in the graph
below with respect to 2005-2009. The annual changes for the five-year period shown in the graph are based on the assumption that $100 had been invested in
Honeywell stock and each index on December 31, 2005 and that all dividends were reinvested.
Dec 2005 Dec 2006 Dec 2007 Dec 2008 Dec 2009 Dec 2010
Honeywell 100 124.17 172.15 94.08 116.49 162.52
S&P 500® 100 115.79 122.16 76.96 97.33 111.99
Composite Index (60/40) 100 115.23 127.14 69.27 80.32 94.19
Composite Index (50/50) 100 116.89 130.72 73.18 85.91
21