HSBC 2004 Annual Report Download - page 84
Download and view the complete annual report
Please find page 84 of the 2004 HSBC annual report below. You can navigate through the pages in the report by either clicking on the pages listed below, or by using the keyword search tool below to find specific information within the annual report.-
 1
1 -
2
-
3
-
4
-
5
-
6
-
7
-
8
-
9
-
10
-
11
-
12
-
13
-
14
-
15
-
16
-
17
-
18
-
19
-
20
-
21
-
22
-
23
-
24
-
25
-
26
-
27
-
28
-
29
-
30
-
31
-
32
-
33
-
34
-
35
-
36
-
37
-
38
-
39
-
40
-
41
-
42
-
43
-
44
-
45
-
46
-
47
-
48
-
49
-
50
-
51
-
52
-
53
-
54
-
55
-
56
-
57
-
58
-
59
-
60
-
61
-
62
-
63
-
64
-
65
-
66
-
67
-
68
-
69
-
70
-
71
-
72
-
73
-
 74
74 -
 75
75 -
 76
76 -
 77
77 -
 78
78 -
 79
79 -
 80
80 -
 81
81 -
 82
82 -
 83
83 -
 84
84 -
 85
85 -
 86
86 -
 87
87 -
 88
88 -
 89
89 -
 90
90 -
 91
91 -
 92
92 -
 93
93 -
 94
94 -
95
-
96
-
97
-
98
-
99
-
100
-
101
-
102
-
103
-
104
-
105
-
106
-
107
-
108
-
109
-
110
-
111
-
112
-
113
-
114
-
115
-
116
-
117
-
118
-
119
-
120
-
121
-
122
-
123
-
124
-
125
-
126
-
127
-
128
-
129
-
130
-
131
-
132
-
133
-
134
-
135
-
136
-
137
-
138
-
139
-
140
-
141
-
142
-
143
-
144
-
145
-
146
-
147
-
148
-
149
-
150
-
151
-
152
-
153
-
154
-
155
-
156
-
157
-
158
-
159
-
160
-
161
-
162
-
163
-
164
-
165
-
166
-
167
-
168
-
169
-
170
-
171
-
172
-
173
-
174
-
175
-
176
-
177
-
178
-
179
-
180
-
181
-
182
-
183
-
184
-
185
-
186
-
187
-
188
-
189
-
190
-
191
-
192
-
193
-
194
-
195
-
196
-
197
-
198
-
199
-
200
-
201
-
202
-
203
-
204
-
205
-
206
-
207
-
208
-
209
-
210
-
211
-
212
-
213
-
214
-
215
-
216
-
217
-
218
-
219
-
220
-
221
-
222
-
223
-
224
-
225
-
226
-
227
-
228
-
229
-
230
-
231
-
232
-
233
-
234
-
235
-
236
-
237
-
238
-
239
-
240
-
241
-
242
-
243
-
244
-
245
-
246
-
247
-
248
-
249
-
250
-
251
-
252
-
253
-
254
-
255
-
256
-
257
-
258
-
259
-
260
-
261
-
262
-
263
-
264
-
265
-
266
-
267
-
268
-
269
-
270
-
271
-
272
-
273
-
274
-
275
-
276
-
277
-
278
-
279
-
280
-
281
-
282
-
283
-
284
-
285
-
286
-
287
-
288
-
289
-
290
-
291
-
292
-
293
-
294
-
295
-
296
-
297
-
298
-
299
-
300
-
301
-
302
-
303
-
304
-
305
-
306
-
307
-
308
-
309
-
310
-
311
-
312
-
313
-
314
-
315
-
316
-
317
-
318
-
319
-
320
-
321
-
322
-
323
-
324
-
325
-
326
-
327
-
328
-
329
-
330
-
331
-
332
-
333
-
334
-
335
-
336
-
337
-
338
-
339
-
340
-
341
-
342
-
343
-
344
-
345
-
346
-
347
-
348
-
349
-
350
-
351
-
352
-
353
-
354
-
355
-
356
-
357
-
358
-
359
-
360
-
361
-
362
-
363
-
364
-
365
-
366
-
367
-
368
-
369
-
370
-
371
-
372
-
373
-
374
-
375
-
376
-
377
-
378
 |
 |

HSBC HOLDINGS PLC
Financial Review (continued)
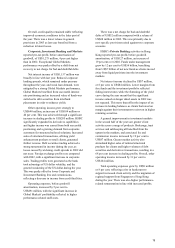
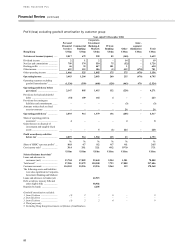
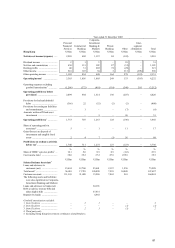
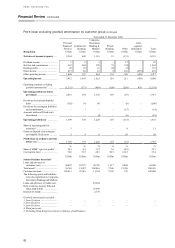
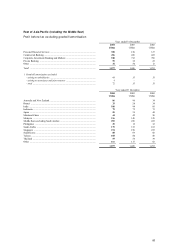
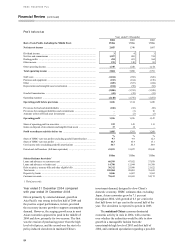
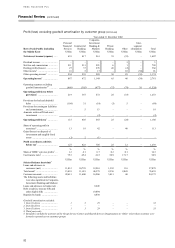
82
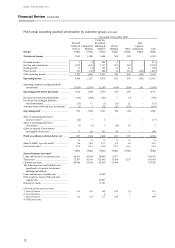
Profit/(loss) excluding goodwill amortisation by customer group (continued)
Year ended 31 December 2002
Hong Kong
Personal
Financial
Services
US$m
Commercial
Banking
US$m
Corporate,
Investment
Banking &
Markets
US$m
Private
Banking
US$m
Other
US$m
Inter-
segment
elimination
US$m
Total
US$m
Net interest income/(expense) ...... 2,364 648 1,161 91 (131) – 4,133
Dividend income ............................ 323–17–25
Net fees and commissions .............. 543 284 399 73 (35) – 1,264
Dealing profits ............................... 45 25 21 44 (2) – 133
Other income ................................. 457 86 41 8 362 (459) 495
Other operating income .................. 1,048 397 464 125 342 (459) 1,917
Operating income ......................... 3,412 1,045 1,625 216 211 (459) 6,050
Operating expenses excluding
goodwill amortisation1 ............... (1,351) (371) (469) (109) (298) 459 (2,139)
Operating profit/(loss) before
provisions1 ................................. 2,061 674 1,156 107 (87) – 3,911
Provisions for bad and doubtful
debts .......................................... (362) 54 68 – (6) – (246)
Provisions for contingent liabilities
and commitments ....................... –1––(15)–(14)
Amounts written off fixed asset
investments ................................ – – (4) – (6) – (10)
Operating profit/(loss)1 ................ 1,699 729 1,220 107 (114) – 3,641
Share of operating profit in
associates2 .................................. 3–––8–11
Gains on disposal of investments
and tangible fixed assets ............ 346–45–58
Profit/(loss) on ordinary activities
before tax3................................. 1,705 733 1,226 107 (61) – 3,710
%%%%% %
Share of HSBC’ s pre-tax profits3 ... 16.2 6.9 11.7 1.0 (0.5) 35.3
Cost:income ratio1 .......................... 39.6 35.5 28.9 50.5 141.2 35.4
US$m US$m US$m US$m US$m US$m
Selected balance sheet data4
Loans and advances to
customers (net) .......................... 34,447 10,797 20,703 1,917 2,084 69,948
Total assets5 .................................... 36,369 15,097 108,063 7,346 13,558 180,433
Customer accounts ......................... 103,413 27,019 11,154 7,142 176 148,904
The following assets and liabilities
were also significant to Corporate,
Investment Banking and Markets:
Loans and advances to banks (net) . 29,284
Debt securities, treasury bills and
other eligible bills ...................... 53,689
Deposits by banks .......................... 2,170
Goodwill amortisation excluded:
1from (1) above ........................... ––––– –
2from (2) above ........................... ––––– –
3from (3) above ........................... ––––– –
4Third party only.
5Excluding Hong Kong Government certificates of indebtedness.