HSBC 2004 Annual Report Download - page 179
Download and view the complete annual report
Please find page 179 of the 2004 HSBC annual report below. You can navigate through the pages in the report by either clicking on the pages listed below, or by using the keyword search tool below to find specific information within the annual report.-
 1
1 -
2
-
3
-
4
-
5
-
6
-
7
-
8
-
9
-
10
-
11
-
12
-
13
-
14
-
15
-
16
-
17
-
18
-
19
-
20
-
21
-
22
-
23
-
24
-
25
-
26
-
27
-
28
-
29
-
30
-
31
-
32
-
33
-
34
-
35
-
36
-
37
-
38
-
39
-
40
-
41
-
42
-
43
-
44
-
45
-
46
-
47
-
48
-
49
-
50
-
51
-
52
-
53
-
54
-
55
-
56
-
57
-
58
-
59
-
60
-
61
-
62
-
63
-
64
-
65
-
66
-
67
-
68
-
69
-
70
-
71
-
72
-
73
-
74
-
75
-
76
-
77
-
78
-
79
-
80
-
81
-
82
-
83
-
84
-
85
-
86
-
87
-
88
-
89
-
90
-
91
-
92
-
93
-
94
-
95
-
96
-
97
-
98
-
99
-
100
-
101
-
102
-
103
-
104
-
105
-
106
-
107
-
108
-
109
-
110
-
111
-
112
-
113
-
114
-
115
-
116
-
117
-
118
-
119
-
120
-
121
-
122
-
123
-
124
-
125
-
126
-
127
-
128
-
129
-
130
-
131
-
132
-
133
-
134
-
135
-
136
-
137
-
138
-
139
-
140
-
141
-
142
-
143
-
144
-
145
-
146
-
147
-
148
-
149
-
150
-
151
-
152
-
153
-
154
-
155
-
156
-
157
-
158
-
159
-
160
-
161
-
162
-
163
-
164
-
165
-
166
-
167
-
168
-
 169
169 -
 170
170 -
 171
171 -
 172
172 -
 173
173 -
 174
174 -
 175
175 -
 176
176 -
 177
177 -
 178
178 -
 179
179 -
 180
180 -
 181
181 -
 182
182 -
 183
183 -
 184
184 -
 185
185 -
 186
186 -
 187
187 -
 188
188 -
 189
189 -
190
-
191
-
192
-
193
-
194
-
195
-
196
-
197
-
198
-
199
-
200
-
201
-
202
-
203
-
204
-
205
-
206
-
207
-
208
-
209
-
210
-
211
-
212
-
213
-
214
-
215
-
216
-
217
-
218
-
219
-
220
-
221
-
222
-
223
-
224
-
225
-
226
-
227
-
228
-
229
-
230
-
231
-
232
-
233
-
234
-
235
-
236
-
237
-
238
-
239
-
240
-
241
-
242
-
243
-
244
-
245
-
246
-
247
-
248
-
249
-
250
-
251
-
252
-
253
-
254
-
255
-
256
-
257
-
258
-
259
-
260
-
261
-
262
-
263
-
264
-
265
-
266
-
267
-
268
-
269
-
270
-
271
-
272
-
273
-
274
-
275
-
276
-
277
-
278
-
279
-
280
-
281
-
282
-
283
-
284
-
285
-
286
-
287
-
288
-
289
-
290
-
291
-
292
-
293
-
294
-
295
-
296
-
297
-
298
-
299
-
300
-
301
-
302
-
303
-
304
-
305
-
306
-
307
-
308
-
309
-
310
-
311
-
312
-
313
-
314
-
315
-
316
-
317
-
318
-
319
-
320
-
321
-
322
-
323
-
324
-
325
-
326
-
327
-
328
-
329
-
330
-
331
-
332
-
333
-
334
-
335
-
336
-
337
-
338
-
339
-
340
-
341
-
342
-
343
-
344
-
345
-
346
-
347
-
348
-
349
-
350
-
351
-
352
-
353
-
354
-
355
-
356
-
357
-
358
-
359
-
360
-
361
-
362
-
363
-
364
-
365
-
366
-
367
-
368
-
369
-
370
-
371
-
372
-
373
-
374
-
375
-
376
-
377
-
378
 |
 |

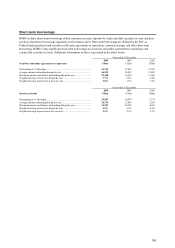
177
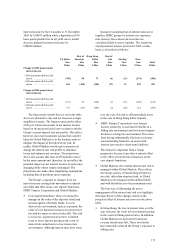
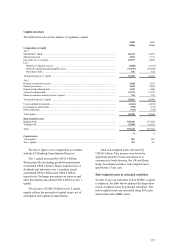
Capital structure
The table below sets out the analysis of regulatory capital.
2004
US$m
2003
US$m
Composition of capital
Tier 1
Shareholders’ funds ........................................................................................................................ 86,623 74,473
Minority interests ............................................................................................................................ 4,253 3,711
Innovative tier 1 securities .............................................................................................................. 10,077 8,094
Less :
Property revaluation reserves ...................................................................................................... (2,660) (1,615)
Goodwill capitalised and intangible assets .................................................................................. (31,190) (29,920)
Own shares held .......................................................................................................................... 156 120
Total qualifying tier 1 capital .......................................................................................................... 67,259 54,863
Tier 2
Property revaluation reserves .......................................................................................................... 2,660 1,615
General provisions .......................................................................................................................... 2,624 2,868
Perpetual subordinated debt ............................................................................................................ 3,670 3,608
Term subordinated debt .................................................................................................................. 21,373 15,795
Minority and other interests in tier 2 capital .................................................................................... 519 523
Total qualifying tier 2 capital .......................................................................................................... 30,846 24,409
Unconsolidated investments ............................................................................................................ (6,361) (4,101)
Investments in other banks .............................................................................................................. (799) (911)
Other deductions ............................................................................................................................. (165) (218)
Total capital .................................................................................................................................... 90,780 74,042
Risk-weighted assets
Banking book .................................................................................................................................. 705,302 577,430
Trading book ................................................................................................................................... 53,908 41,232
Total ................................................................................................................................................ 759,210 618,662
%%
Capital ratios:
Total capital .................................................................................................................................... 12.0 12.0
Tier 1 capital ................................................................................................................................... 8.9 8.9
The above figures were computed in accordance
with the EU Banking Consolidation Directive.
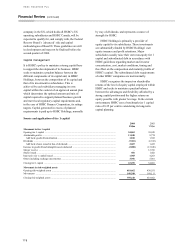
Tier 1 capital increased by US$12.4 billion.
Retained profits (excluding goodwill amortisation)
contributed US$6.4 billion. Shares issued in lieu of
dividends and innovative tier 1 securities issued
contributed US$2.6 billion and US$2.0 billion,
respectively. Exchange movements on reserves and
other movements also added US$1.4 billion to tier 1
capital.
The increase of US$6.4 billion in tier 2 capital
mainly reflects the proceeds of capital issues, net of
redemption and regulatory amortisation.
Total risk-weighted assets increased by
US$141 billion. This increase was driven by
significant growth in loans and advances to
customers in North America, the UK and Hong
Kong. In constant currency, risk-weighted asset
growth was 17 per cent.
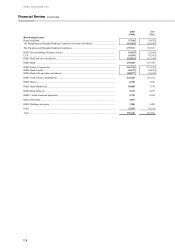
Risk-weighted assets by principal subsidiary
In order to give an indication of how HSBC’ s capital
is deployed, the table below analyses the disposition
of risk-weighted assets by principal subsidiary. The
risk-weighted assets are calculated using FSA rules
and exclude intra-HSBC items.