HSBC 2004 Annual Report Download - page 29
Download and view the complete annual report
Please find page 29 of the 2004 HSBC annual report below. You can navigate through the pages in the report by either clicking on the pages listed below, or by using the keyword search tool below to find specific information within the annual report.-
 1
1 -
2
-
3
-
4
-
5
-
6
-
7
-
8
-
9
-
10
-
11
-
12
-
13
-
14
-
15
-
16
-
17
-
18
-
 19
19 -
 20
20 -
 21
21 -
 22
22 -
 23
23 -
 24
24 -
 25
25 -
 26
26 -
 27
27 -
 28
28 -
 29
29 -
 30
30 -
 31
31 -
 32
32 -
 33
33 -
 34
34 -
 35
35 -
 36
36 -
 37
37 -
 38
38 -
 39
39 -
40
-
41
-
42
-
43
-
44
-
45
-
46
-
47
-
48
-
49
-
50
-
51
-
52
-
53
-
54
-
55
-
56
-
57
-
58
-
59
-
60
-
61
-
62
-
63
-
64
-
65
-
66
-
67
-
68
-
69
-
70
-
71
-
72
-
73
-
74
-
75
-
76
-
77
-
78
-
79
-
80
-
81
-
82
-
83
-
84
-
85
-
86
-
87
-
88
-
89
-
90
-
91
-
92
-
93
-
94
-
95
-
96
-
97
-
98
-
99
-
100
-
101
-
102
-
103
-
104
-
105
-
106
-
107
-
108
-
109
-
110
-
111
-
112
-
113
-
114
-
115
-
116
-
117
-
118
-
119
-
120
-
121
-
122
-
123
-
124
-
125
-
126
-
127
-
128
-
129
-
130
-
131
-
132
-
133
-
134
-
135
-
136
-
137
-
138
-
139
-
140
-
141
-
142
-
143
-
144
-
145
-
146
-
147
-
148
-
149
-
150
-
151
-
152
-
153
-
154
-
155
-
156
-
157
-
158
-
159
-
160
-
161
-
162
-
163
-
164
-
165
-
166
-
167
-
168
-
169
-
170
-
171
-
172
-
173
-
174
-
175
-
176
-
177
-
178
-
179
-
180
-
181
-
182
-
183
-
184
-
185
-
186
-
187
-
188
-
189
-
190
-
191
-
192
-
193
-
194
-
195
-
196
-
197
-
198
-
199
-
200
-
201
-
202
-
203
-
204
-
205
-
206
-
207
-
208
-
209
-
210
-
211
-
212
-
213
-
214
-
215
-
216
-
217
-
218
-
219
-
220
-
221
-
222
-
223
-
224
-
225
-
226
-
227
-
228
-
229
-
230
-
231
-
232
-
233
-
234
-
235
-
236
-
237
-
238
-
239
-
240
-
241
-
242
-
243
-
244
-
245
-
246
-
247
-
248
-
249
-
250
-
251
-
252
-
253
-
254
-
255
-
256
-
257
-
258
-
259
-
260
-
261
-
262
-
263
-
264
-
265
-
266
-
267
-
268
-
269
-
270
-
271
-
272
-
273
-
274
-
275
-
276
-
277
-
278
-
279
-
280
-
281
-
282
-
283
-
284
-
285
-
286
-
287
-
288
-
289
-
290
-
291
-
292
-
293
-
294
-
295
-
296
-
297
-
298
-
299
-
300
-
301
-
302
-
303
-
304
-
305
-
306
-
307
-
308
-
309
-
310
-
311
-
312
-
313
-
314
-
315
-
316
-
317
-
318
-
319
-
320
-
321
-
322
-
323
-
324
-
325
-
326
-
327
-
328
-
329
-
330
-
331
-
332
-
333
-
334
-
335
-
336
-
337
-
338
-
339
-
340
-
341
-
342
-
343
-
344
-
345
-
346
-
347
-
348
-
349
-
350
-
351
-
352
-
353
-
354
-
355
-
356
-
357
-
358
-
359
-
360
-
361
-
362
-
363
-
364
-
365
-
366
-
367
-
368
-
369
-
370
-
371
-
372
-
373
-
374
-
375
-
376
-
377
-
378
 |
 |

27
HSBC Mexico, acquired in November 2002,
together with the impact of a weaker US dollar on
translating revenues and costs arising in other
currencies. These factors are important to an
understanding of HSBC’ s performance in 2003. It is
also important to recognise the structural effect on
reported financial performance of the acquisition of
HSBC Finance Corporation.
The shape of the Group’s profit and loss account
changed as a result of the HSBC Finance
Corporation acquisition, reflecting the nature of its
business model. HSBC Finance generally serves
non-conforming and sub-prime customers who, for a
variety of reasons, have a higher delinquency and
credit loss probability. These customers are charged
a higher rate of interest to compensate for this
additional risk of loss. As a consequence, HSBC
Finance’s net interest income is a much higher
proportion of its total revenues than in the rest of
HSBC, and a much higher proportion of HSBC
Finance’s pre-provision profitability is absorbed in
bad and doubtful debt charges than is normally the
case in the rest of HSBC.
HSBC made a profit on ordinary activities
before tax of US$12,816 million in 2003, an increase
of US$3,166 million, or 33 per cent, compared with
2002. HSBC Finance and HSBC Mexico accounted
for over 70 per cent of this increase. HSBC Finance
contributed US$1,827 million in its first nine
months, while HSBC Mexico contributed
US$441 million in its first full year.
Excluding goodwill amortisation, HSBC
Finance and HSBC Mexico contributed
US$2,208 million and US$534 million respectively
to profit before tax, which grew by
US$3,888 million or 37 per cent to
US$14,401 million. Underlying growth, on a
constant currency basis, was 7 per cent. Goodwill
amortisation increased by US$722 million to
US$1,585 million in 2003, reflecting acquisitions,
currency movements and the write down of goodwill
attributed to a fund management company
previously acquired as part of the CCF acquisition.
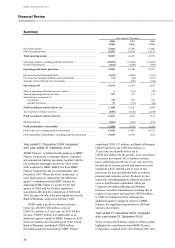
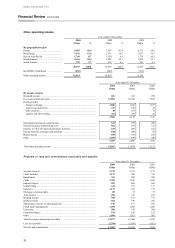
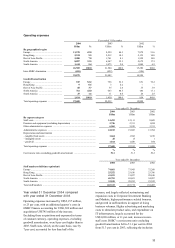
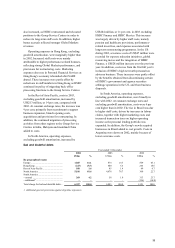
Net interest income
Year ended 31 December
2004 2003 2002
US$m % US$m % US$m %
By geographical region
Europe..................................................... 9,062 29.2 7,540 29.5 6,343 41.0
Hong Kong.............................................. 3,639 11.7 3,901 15.2 4,133 26.7
Rest of Asia-Pacific ................................ 2,055 6.6 1,740 6.8 1,607 10.4
North America ........................................ 14,913 48.1 11,777 46.0 2,732 17.7
South America ........................................ 1,355 4.4 640 2.5 645 4.2
Net interest income ................................. 31,024 100.0 25,598 100.0 15,460 100.0
Year ended 31 December
2004 2003 2002
US$m US$m US$m
Net interest income ........................................................................................ 31,024 25,598 15,460
Average interest-earning assets ...................................................................... 964,305 778,415 608,749
Gross interest yield (per cent)1 ....................................................................... 5.21 5.13 4.70
Net interest spread (per cent)2 ........................................................................ 3.01 3.06 2.27
Net interest margin (per cent)3 ....................................................................... 3.22 3.29 2.54
1Gross interest yield is the average interest rate earned on average interest-earning assets (AIEA).
2Net interest spread is the difference between the average interest rate earned on average interest-earning assets and the average
interest rate paid on average interest-bearing funds.
3Net interest margin is net interest income expressed as a percentage of average interest-earning assets.