HSBC 2004 Annual Report Download - page 317
Download and view the complete annual report
Please find page 317 of the 2004 HSBC annual report below. You can navigate through the pages in the report by either clicking on the pages listed below, or by using the keyword search tool below to find specific information within the annual report.-
 1
1 -
2
-
3
-
4
-
5
-
6
-
7
-
8
-
9
-
10
-
11
-
12
-
13
-
14
-
15
-
16
-
17
-
18
-
19
-
20
-
21
-
22
-
23
-
24
-
25
-
26
-
27
-
28
-
29
-
30
-
31
-
32
-
33
-
34
-
35
-
36
-
37
-
38
-
39
-
40
-
41
-
42
-
43
-
44
-
45
-
46
-
47
-
48
-
49
-
50
-
51
-
52
-
53
-
54
-
55
-
56
-
57
-
58
-
59
-
60
-
61
-
62
-
63
-
64
-
65
-
66
-
67
-
68
-
69
-
70
-
71
-
72
-
73
-
74
-
75
-
76
-
77
-
78
-
79
-
80
-
81
-
82
-
83
-
84
-
85
-
86
-
87
-
88
-
89
-
90
-
91
-
92
-
93
-
94
-
95
-
96
-
97
-
98
-
99
-
100
-
101
-
102
-
103
-
104
-
105
-
106
-
107
-
108
-
109
-
110
-
111
-
112
-
113
-
114
-
115
-
116
-
117
-
118
-
119
-
120
-
121
-
122
-
123
-
124
-
125
-
126
-
127
-
128
-
129
-
130
-
131
-
132
-
133
-
134
-
135
-
136
-
137
-
138
-
139
-
140
-
141
-
142
-
143
-
144
-
145
-
146
-
147
-
148
-
149
-
150
-
151
-
152
-
153
-
154
-
155
-
156
-
157
-
158
-
159
-
160
-
161
-
162
-
163
-
164
-
165
-
166
-
167
-
168
-
169
-
170
-
171
-
172
-
173
-
174
-
175
-
176
-
177
-
178
-
179
-
180
-
181
-
182
-
183
-
184
-
185
-
186
-
187
-
188
-
189
-
190
-
191
-
192
-
193
-
194
-
195
-
196
-
197
-
198
-
199
-
200
-
201
-
202
-
203
-
204
-
205
-
206
-
207
-
208
-
209
-
210
-
211
-
212
-
213
-
214
-
215
-
216
-
217
-
218
-
219
-
220
-
221
-
222
-
223
-
224
-
225
-
226
-
227
-
228
-
229
-
230
-
231
-
232
-
233
-
234
-
235
-
236
-
237
-
238
-
239
-
240
-
241
-
242
-
243
-
244
-
245
-
246
-
247
-
248
-
249
-
250
-
251
-
252
-
253
-
254
-
255
-
256
-
257
-
258
-
259
-
260
-
261
-
262
-
263
-
264
-
265
-
266
-
267
-
268
-
269
-
270
-
271
-
272
-
273
-
274
-
275
-
276
-
277
-
278
-
279
-
280
-
281
-
282
-
283
-
284
-
285
-
286
-
287
-
288
-
289
-
290
-
291
-
292
-
293
-
294
-
295
-
296
-
297
-
298
-
299
-
300
-
301
-
302
-
303
-
304
-
305
-
306
-
 307
307 -
 308
308 -
 309
309 -
 310
310 -
 311
311 -
 312
312 -
 313
313 -
 314
314 -
 315
315 -
 316
316 -
 317
317 -
 318
318 -
 319
319 -
 320
320 -
 321
321 -
 322
322 -
 323
323 -
 324
324 -
 325
325 -
 326
326 -
 327
327 -
328
-
329
-
330
-
331
-
332
-
333
-
334
-
335
-
336
-
337
-
338
-
339
-
340
-
341
-
342
-
343
-
344
-
345
-
346
-
347
-
348
-
349
-
350
-
351
-
352
-
353
-
354
-
355
-
356
-
357
-
358
-
359
-
360
-
361
-
362
-
363
-
364
-
365
-
366
-
367
-
368
-
369
-
370
-
371
-
372
-
373
-
374
-
375
-
376
-
377
-
378
 |
 |

315
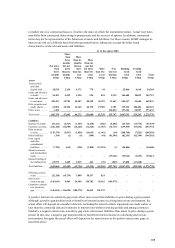
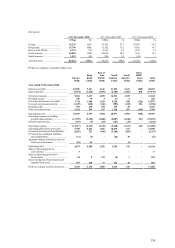
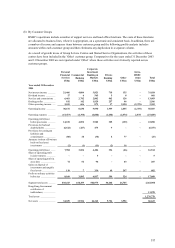
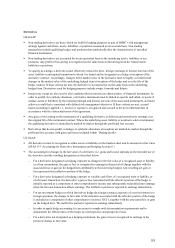
Net assets:
At 31 December 2004 At 31 December 2003 At 31 December 2002
US$m % US$m % US$m %
Europe ......................................... 36,136 41.7 35,102 47.1 30,681 59.3
Hong Kong .................................. 15,706 18.1 11,302 15.2 9,682 18.7
Rest of Asia-Pacific ..................... 6,375 7.4 5,145 6.9 3,811 7.3
North America ............................. 26,883 31.0 22,044 29.6 7,613 14.7
South America ............................. 1,523 1.8 880 1.2 (22) –
Total net assets ............................ 86,623 100.0 74,473 100.0 51,765 100.0
Profit on ordinary activities before tax:
Hong
Rest of
Asia- North South
Intra-
HSBC
Europe Kong Pacific America America items Total
US$m US$m US$m US$m US$m US$m US$m
Year ended 31 December 2004
Interest receivable ................................... 18,096 5,167 4,146 21,201 2,421 (828) 50,203
Interest payable ....................................... (9,034) (1,528) (2,091) (6,288) (1,066) 828 (19,179)
Net interest income ................................. 9,062 3,639 2,055 14,913 1,355 – 31,024
Dividend income .................................... 545 19 3 32 2 – 601
Fees and commissions receivable ........... 7,724 1,986 1,303 4,520 580 (236) 15,877
Fees and commissions payable ............... (1,429) (260) (246) (985) (100) 236 (2,784)
Dealing profits ........................................ 953 630 494 439 50 –2,566
Other operating income .......................... 1,592 781 195 1,158 207 (630) 3,303
Operating income ................................... 18,447 6,795 3,804 20,077 2,094 (630) 50,587
Operating expenses (excluding
goodwill amortisation) ........................ (11,570) (2,524) (2,080) (8,887) (1,444) 630 (25,875)
Goodwill amortisation ............................ (947) (9) (68) (761) (29) – (1,814)
Operating expenses ................................. (12,517) (2,533) (2,148) (9,648) (1,473) 630 (27,689)
Operating profit before provisions .......... 5,930 4,262 1,656 10,429 621 –22,898
Provisions for bad and doubtful debts ..... (1,025) 223 (100) (5,186) (269) –(6,357)
Provisions for contingent liabilities
and commitments ............................... (12) (3) – (42) 30 – (27)
Amounts (written off)/written back on
fixed asset investments ....................... (20) 26 – – (6) – –
Operating profit ...................................... 4,873 4,508 1,556 5,201 376 – 16,514
Share of operating profit in
joint ventures ...................................... 5–––––5
Share of operating profit/(loss)
in associates ........................................ 54 8 232 (8) 1 – 287
Gains on disposal of investments and
tangible fixed assets ............................ 293 228 17 226 38 – 802
Profit on ordinary activities before tax .... 5,225 4,744 1,805 5,419 415 – 17,608