HSBC 2004 Annual Report Download - page 345
Download and view the complete annual report
Please find page 345 of the 2004 HSBC annual report below. You can navigate through the pages in the report by either clicking on the pages listed below, or by using the keyword search tool below to find specific information within the annual report.-
 1
1 -
2
-
3
-
4
-
5
-
6
-
7
-
8
-
9
-
10
-
11
-
12
-
13
-
14
-
15
-
16
-
17
-
18
-
19
-
20
-
21
-
22
-
23
-
24
-
25
-
26
-
27
-
28
-
29
-
30
-
31
-
32
-
33
-
34
-
35
-
36
-
37
-
38
-
39
-
40
-
41
-
42
-
43
-
44
-
45
-
46
-
47
-
48
-
49
-
50
-
51
-
52
-
53
-
54
-
55
-
56
-
57
-
58
-
59
-
60
-
61
-
62
-
63
-
64
-
65
-
66
-
67
-
68
-
69
-
70
-
71
-
72
-
73
-
74
-
75
-
76
-
77
-
78
-
79
-
80
-
81
-
82
-
83
-
84
-
85
-
86
-
87
-
88
-
89
-
90
-
91
-
92
-
93
-
94
-
95
-
96
-
97
-
98
-
99
-
100
-
101
-
102
-
103
-
104
-
105
-
106
-
107
-
108
-
109
-
110
-
111
-
112
-
113
-
114
-
115
-
116
-
117
-
118
-
119
-
120
-
121
-
122
-
123
-
124
-
125
-
126
-
127
-
128
-
129
-
130
-
131
-
132
-
133
-
134
-
135
-
136
-
137
-
138
-
139
-
140
-
141
-
142
-
143
-
144
-
145
-
146
-
147
-
148
-
149
-
150
-
151
-
152
-
153
-
154
-
155
-
156
-
157
-
158
-
159
-
160
-
161
-
162
-
163
-
164
-
165
-
166
-
167
-
168
-
169
-
170
-
171
-
172
-
173
-
174
-
175
-
176
-
177
-
178
-
179
-
180
-
181
-
182
-
183
-
184
-
185
-
186
-
187
-
188
-
189
-
190
-
191
-
192
-
193
-
194
-
195
-
196
-
197
-
198
-
199
-
200
-
201
-
202
-
203
-
204
-
205
-
206
-
207
-
208
-
209
-
210
-
211
-
212
-
213
-
214
-
215
-
216
-
217
-
218
-
219
-
220
-
221
-
222
-
223
-
224
-
225
-
226
-
227
-
228
-
229
-
230
-
231
-
232
-
233
-
234
-
235
-
236
-
237
-
238
-
239
-
240
-
241
-
242
-
243
-
244
-
245
-
246
-
247
-
248
-
249
-
250
-
251
-
252
-
253
-
254
-
255
-
256
-
257
-
258
-
259
-
260
-
261
-
262
-
263
-
264
-
265
-
266
-
267
-
268
-
269
-
270
-
271
-
272
-
273
-
274
-
275
-
276
-
277
-
278
-
279
-
280
-
281
-
282
-
283
-
284
-
285
-
286
-
287
-
288
-
289
-
290
-
291
-
292
-
293
-
294
-
295
-
296
-
297
-
298
-
299
-
300
-
301
-
302
-
303
-
304
-
305
-
306
-
307
-
308
-
309
-
310
-
311
-
312
-
313
-
314
-
315
-
316
-
317
-
318
-
319
-
320
-
321
-
322
-
323
-
324
-
325
-
326
-
327
-
328
-
329
-
330
-
331
-
332
-
333
-
334
-
 335
335 -
 336
336 -
 337
337 -
 338
338 -
 339
339 -
 340
340 -
 341
341 -
 342
342 -
 343
343 -
 344
344 -
 345
345 -
 346
346 -
 347
347 -
 348
348 -
 349
349 -
 350
350 -
 351
351 -
 352
352 -
 353
353 -
 354
354 -
 355
355 -
356
-
357
-
358
-
359
-
360
-
361
-
362
-
363
-
364
-
365
-
366
-
367
-
368
-
369
-
370
-
371
-
372
-
373
-
374
-
375
-
376
-
377
-
378
 |
 |

343
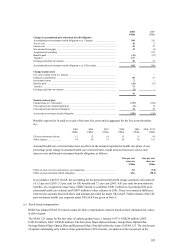
2004 2003
US$m US$m
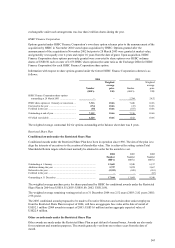
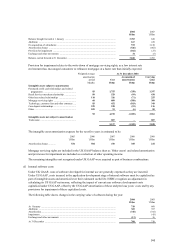
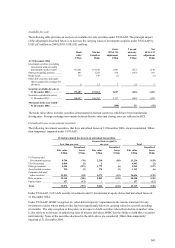
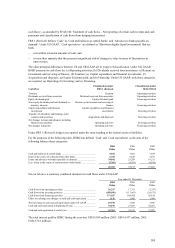
Balance brought forward at 1 January .................................................................................... 3,703 620
Additions ................................................................................................................................ 167 419
On acquisition of subsidiaries .................................................................................................572 3,158
Amortisation charge ............................................................................................................... (526) (462)
Provision for impairment ........................................................................................................ (102) (27)
Exchange and other movements ............................................................................................. 34 (5)
Balance carried forward at 31 December ................................................................................ 3,848 3,703
Provision for impairment relates to the write-down of mortgage servicing rights, as a low interest rate
environment has encouraged consumers to refinance mortgages at a faster rate than initially expected.
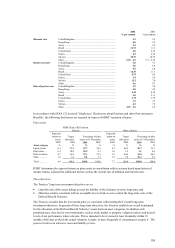
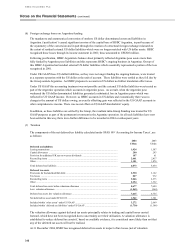
Weighted average At 31 December 2004
amortisation Accumulated Carrying
period Cost amortisation value
Months US$m US$m US$m
Intangible assets subject to amortisation
Purchased credit card relationships and related
programmes ...................................................... 83 1,755 (358) 1,397
Retail Services merchant relationship ................... 89 529 (99) 430
Other loan related relationships ............................ 110 326 (71) 255
Mortgage servicing rights ..................................... 60 889 (580) 309
Technology, customer lists and other contracts .... 83 452 (103) 349
Core deposit relationships ..................................... 229 228 (92) 136
Other ..................................................................... 109 91 (6) 85
92 4,270 (1,309) 2,961
Intangible assets not subject to amortisation
Trade name ........................................................... 887 – 887
5,157 (1,309) 3,848
The intangible asset amortisation expense for the next five years is estimated to be:
2005 2006 2007 2008 2009
US$m US$m US$m US$m US$m
Amortisation charge ............ 534 504 470 358 232
Mortgage servicing rights are included in the UK GAAP balance sheet as ‘Other assets’ and related amortisation
and provisions for impairment are included as a reduction of other operating income.
The remaining intangibles not recognised under UK GAAP were acquired as part of business combinations.
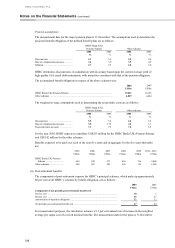
(f) Internal software costs
Under UK GAAP, costs of software developed for internal use are generally expensed as they are incurred.
Under US GAAP, costs incurred in the application development stage of internal software must be capitalised as
part of intangible assets and amortised over their estimated useful life. HSBC recognises an adjustment in
calculating its US GAAP net income, reflecting the impact of current year software development costs
capitalised under US GAAP, offset by the US GAAP amortisation of these and previous years’ costs and by any
provisions for impairment of these capitalised costs.
The following table shows changes in the carrying value of software during the year:
2004 2003
US$m US$m
At 1 January ............................................................................................................................ 718 669
Additions ................................................................................................................................ 365 397
Amortisation............................................................................................................................ (310) (341)
Impairment .............................................................................................................................. – (43)
Exchange and other movements ............................................................................................. (13) 36
At 31 December ...................................................................................................................... 760 718