HSBC 2004 Annual Report Download - page 178
Download and view the complete annual report
Please find page 178 of the 2004 HSBC annual report below. You can navigate through the pages in the report by either clicking on the pages listed below, or by using the keyword search tool below to find specific information within the annual report.-
 1
1 -
2
-
3
-
4
-
5
-
6
-
7
-
8
-
9
-
10
-
11
-
12
-
13
-
14
-
15
-
16
-
17
-
18
-
19
-
20
-
21
-
22
-
23
-
24
-
25
-
26
-
27
-
28
-
29
-
30
-
31
-
32
-
33
-
34
-
35
-
36
-
37
-
38
-
39
-
40
-
41
-
42
-
43
-
44
-
45
-
46
-
47
-
48
-
49
-
50
-
51
-
52
-
53
-
54
-
55
-
56
-
57
-
58
-
59
-
60
-
61
-
62
-
63
-
64
-
65
-
66
-
67
-
68
-
69
-
70
-
71
-
72
-
73
-
74
-
75
-
76
-
77
-
78
-
79
-
80
-
81
-
82
-
83
-
84
-
85
-
86
-
87
-
88
-
89
-
90
-
91
-
92
-
93
-
94
-
95
-
96
-
97
-
98
-
99
-
100
-
101
-
102
-
103
-
104
-
105
-
106
-
107
-
108
-
109
-
110
-
111
-
112
-
113
-
114
-
115
-
116
-
117
-
118
-
119
-
120
-
121
-
122
-
123
-
124
-
125
-
126
-
127
-
128
-
129
-
130
-
131
-
132
-
133
-
134
-
135
-
136
-
137
-
138
-
139
-
140
-
141
-
142
-
143
-
144
-
145
-
146
-
147
-
148
-
149
-
150
-
151
-
152
-
153
-
154
-
155
-
156
-
157
-
158
-
159
-
160
-
161
-
162
-
163
-
164
-
165
-
166
-
167
-
 168
168 -
 169
169 -
 170
170 -
 171
171 -
 172
172 -
 173
173 -
 174
174 -
 175
175 -
 176
176 -
 177
177 -
 178
178 -
 179
179 -
 180
180 -
 181
181 -
 182
182 -
 183
183 -
 184
184 -
 185
185 -
 186
186 -
 187
187 -
 188
188 -
189
-
190
-
191
-
192
-
193
-
194
-
195
-
196
-
197
-
198
-
199
-
200
-
201
-
202
-
203
-
204
-
205
-
206
-
207
-
208
-
209
-
210
-
211
-
212
-
213
-
214
-
215
-
216
-
217
-
218
-
219
-
220
-
221
-
222
-
223
-
224
-
225
-
226
-
227
-
228
-
229
-
230
-
231
-
232
-
233
-
234
-
235
-
236
-
237
-
238
-
239
-
240
-
241
-
242
-
243
-
244
-
245
-
246
-
247
-
248
-
249
-
250
-
251
-
252
-
253
-
254
-
255
-
256
-
257
-
258
-
259
-
260
-
261
-
262
-
263
-
264
-
265
-
266
-
267
-
268
-
269
-
270
-
271
-
272
-
273
-
274
-
275
-
276
-
277
-
278
-
279
-
280
-
281
-
282
-
283
-
284
-
285
-
286
-
287
-
288
-
289
-
290
-
291
-
292
-
293
-
294
-
295
-
296
-
297
-
298
-
299
-
300
-
301
-
302
-
303
-
304
-
305
-
306
-
307
-
308
-
309
-
310
-
311
-
312
-
313
-
314
-
315
-
316
-
317
-
318
-
319
-
320
-
321
-
322
-
323
-
324
-
325
-
326
-
327
-
328
-
329
-
330
-
331
-
332
-
333
-
334
-
335
-
336
-
337
-
338
-
339
-
340
-
341
-
342
-
343
-
344
-
345
-
346
-
347
-
348
-
349
-
350
-
351
-
352
-
353
-
354
-
355
-
356
-
357
-
358
-
359
-
360
-
361
-
362
-
363
-
364
-
365
-
366
-
367
-
368
-
369
-
370
-
371
-
372
-
373
-
374
-
375
-
376
-
377
-
378
 |
 |

HSBC HOLDINGS PLC
Financial Review (continued)
176
company in the US, which holds all HSBC’ s US
operating subsidiaries and HSBC Canada, will be
expected to qualify for, and comply with, the Federal
Reserve Board’ s ‘advanced’ risk and capital
methodologies of Basel II. These guidelines are still
in development and may not be finalised before the
second quarter of 2006.
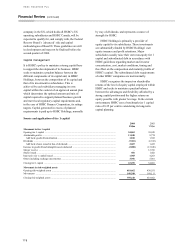
Capital management
It is HSBC’ s policy to maintain a strong capital base
to support the development of its business. HSBC
seeks to maintain a prudent balance between the
different components of its capital and, in HSBC
Holdings, between the composition of its capital and
that of its investment in subsidiaries. This is
achieved by each subsidiary managing its own
capital within the context of an approved annual plan
which determines the optimal amount and mix of
capital required to support planned business growth
and meet local regulatory capital requirements and,
in the case of HSBC Finance Corporation, its ratings
targets. Capital generated in excess of planned
requirements is paid up to HSBC Holdings, normally
by way of dividends, and represents a source of
strength for HSBC.
HSBC Holdings is primarily a provider of
equity capital to its subsidiaries. These investments
are substantially funded by HSBC Holdings’ own
equity issuance and profit retentions. Major
subsidiaries usually raise their own non-equity tier 1
capital and subordinated debt in accordance with
HSBC guidelines regarding market and investor
concentration, cost, market conditions, timing and
the effect on the composition and maturity profile of
HSBC’s capital. The subordinated debt requirements
of other HSBC companies are met internally.
HSBC recognises the impact on shareholder
returns of the level of equity capital employed within
HSBC and seeks to maintain a prudent balance
between the advantages and flexibility afforded by a
strong capital position and the higher returns on
equity possible with greater leverage. In the current
environment, HSBC uses a benchmark tier 1 capital
ratio of 8.25 per cent in considering its long-term
capital planning.
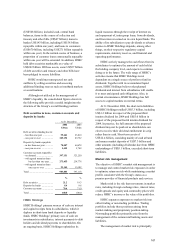
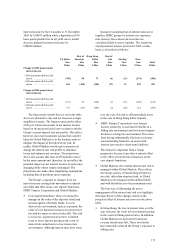
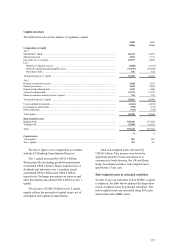
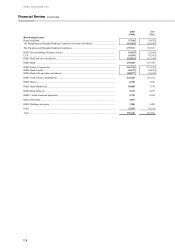
Source and application of tier 1 capital
2004
US$m
2003
US$m
Movement in tier 1 capital
Opening tier 1 capital ...................................................................................................................... 54,863 38,949
Attributable profits .......................................................................................................................... 11,840 8,774
Add back: goodwill amortisation ................................................................................................ 1,818 1,585
Dividends ........................................................................................................................................ (7,301) (6,532)
Add back: shares issued in lieu of dividends ............................................................................... 2,607 1,423
Increase in goodwill and intangible assets deducted ....................................................................... (3,088) (13,650)
Merger reserve ................................................................................................................................ –12,768
Shares issued ................................................................................................................................... 581 1,482
Innovative tier 1 capital issued ........................................................................................................ 1,983 4,263
Other (including exchange movements) .......................................................................................... 3,956 5,801
Closing tier 1 capital ....................................................................................................................... 67,259 54,863
Movement in risk-weighted assets
Opening risk-weighted assets .......................................................................................................... 618,662 430,551
Movements ..................................................................................................................................... 140,548 188,111
Closing risk-weighted assets ........................................................................................................... 759,210 618,662