HSBC 2004 Annual Report Download - page 60
Download and view the complete annual report
Please find page 60 of the 2004 HSBC annual report below. You can navigate through the pages in the report by either clicking on the pages listed below, or by using the keyword search tool below to find specific information within the annual report.-
 1
1 -
2
-
3
-
4
-
5
-
6
-
7
-
8
-
9
-
10
-
11
-
12
-
13
-
14
-
15
-
16
-
17
-
18
-
19
-
20
-
21
-
22
-
23
-
24
-
25
-
26
-
27
-
28
-
29
-
30
-
31
-
32
-
33
-
34
-
35
-
36
-
37
-
38
-
39
-
40
-
41
-
42
-
43
-
44
-
45
-
46
-
47
-
48
-
49
-
 50
50 -
 51
51 -
 52
52 -
 53
53 -
 54
54 -
 55
55 -
 56
56 -
 57
57 -
 58
58 -
 59
59 -
 60
60 -
 61
61 -
 62
62 -
 63
63 -
 64
64 -
 65
65 -
 66
66 -
 67
67 -
 68
68 -
 69
69 -
 70
70 -
71
-
72
-
73
-
74
-
75
-
76
-
77
-
78
-
79
-
80
-
81
-
82
-
83
-
84
-
85
-
86
-
87
-
88
-
89
-
90
-
91
-
92
-
93
-
94
-
95
-
96
-
97
-
98
-
99
-
100
-
101
-
102
-
103
-
104
-
105
-
106
-
107
-
108
-
109
-
110
-
111
-
112
-
113
-
114
-
115
-
116
-
117
-
118
-
119
-
120
-
121
-
122
-
123
-
124
-
125
-
126
-
127
-
128
-
129
-
130
-
131
-
132
-
133
-
134
-
135
-
136
-
137
-
138
-
139
-
140
-
141
-
142
-
143
-
144
-
145
-
146
-
147
-
148
-
149
-
150
-
151
-
152
-
153
-
154
-
155
-
156
-
157
-
158
-
159
-
160
-
161
-
162
-
163
-
164
-
165
-
166
-
167
-
168
-
169
-
170
-
171
-
172
-
173
-
174
-
175
-
176
-
177
-
178
-
179
-
180
-
181
-
182
-
183
-
184
-
185
-
186
-
187
-
188
-
189
-
190
-
191
-
192
-
193
-
194
-
195
-
196
-
197
-
198
-
199
-
200
-
201
-
202
-
203
-
204
-
205
-
206
-
207
-
208
-
209
-
210
-
211
-
212
-
213
-
214
-
215
-
216
-
217
-
218
-
219
-
220
-
221
-
222
-
223
-
224
-
225
-
226
-
227
-
228
-
229
-
230
-
231
-
232
-
233
-
234
-
235
-
236
-
237
-
238
-
239
-
240
-
241
-
242
-
243
-
244
-
245
-
246
-
247
-
248
-
249
-
250
-
251
-
252
-
253
-
254
-
255
-
256
-
257
-
258
-
259
-
260
-
261
-
262
-
263
-
264
-
265
-
266
-
267
-
268
-
269
-
270
-
271
-
272
-
273
-
274
-
275
-
276
-
277
-
278
-
279
-
280
-
281
-
282
-
283
-
284
-
285
-
286
-
287
-
288
-
289
-
290
-
291
-
292
-
293
-
294
-
295
-
296
-
297
-
298
-
299
-
300
-
301
-
302
-
303
-
304
-
305
-
306
-
307
-
308
-
309
-
310
-
311
-
312
-
313
-
314
-
315
-
316
-
317
-
318
-
319
-
320
-
321
-
322
-
323
-
324
-
325
-
326
-
327
-
328
-
329
-
330
-
331
-
332
-
333
-
334
-
335
-
336
-
337
-
338
-
339
-
340
-
341
-
342
-
343
-
344
-
345
-
346
-
347
-
348
-
349
-
350
-
351
-
352
-
353
-
354
-
355
-
356
-
357
-
358
-
359
-
360
-
361
-
362
-
363
-
364
-
365
-
366
-
367
-
368
-
369
-
370
-
371
-
372
-
373
-
374
-
375
-
376
-
377
-
378
 |
 |

HSBC HOLDINGS PLC
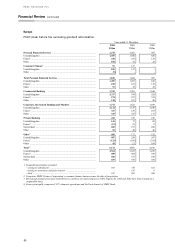
Financial Review (continued)
58
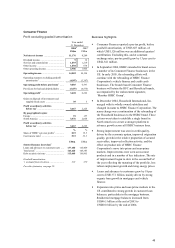
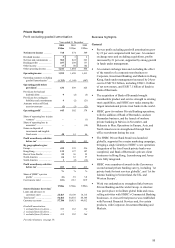
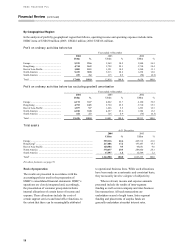
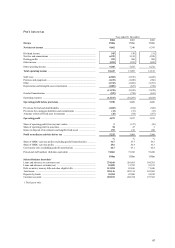
By Geographical Region:
In the analysis of profit by geographical region that follows, operating income and operating expenses include intra-
HSBC items of US$630 million (2003: US$422 million; 2002: US$326 million).
Profit on ordinary activities before tax
Year ended 31 December
2004 2003 2002
US$m % US$m % US$m %
Europe .................................................. 5,225 29.6 3,969 30.9 3,500 36.3
Hong Kong ........................................... 4,744 26.9 3,728 29.1 3,710 38.4
Rest of Asia-Pacific ............................. 1,805 10.3 1,391 10.9 1,260 13.1
North America ..................................... 5,419 30.8 3,613 28.2 1,238 12.8
South America ..................................... 415 2.4 115 0.9 (58) (0.6)
Total ..................................................... 17,608 100.0 12,816 100.0 9,650 100.0
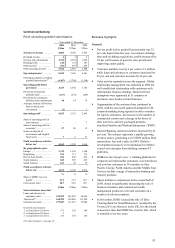
Profit on ordinary activities before tax excluding goodwill amortisation
Year ended 31 December
2004 2003 2002
US$m % US$m % US$m %
Europe .................................................. 6,172 31.7 4,862 33.7 4,160 39.5
Hong Kong ........................................... 4,753 24.5 3,730 25.9 3,710 35.3
Rest of Asia-Pacific ............................. 1,877 9.7 1,426 9.9 1,293 12.3
North America ..................................... 6,180 31.8 4,257 29.6 1,384 13.2
South America ..................................... 444 2.3 126 0.9 (34) (0.3)
Total ..................................................... 19,426 100.0 14,401 100.0 10,513 100.0
Total assets
At 31 December
2004 2003
US$m % US$m %
Europe ....................................................................................................... 539,116 42.6 425,312 41.6
Hong Kong8 ............................................................................................... 217,406 17.2 197,487 19.3
Rest of Asia-Pacific .................................................................................. 120,504 9.5 98,081 9.6
North America .......................................................................................... 370,477 29.3 289,800 28.3
South America .......................................................................................... 17,397 1.4 12,549 1.2
Total8 ........................................................................................................ 1,264,900 100.0 1,023,229 100.0
For above footnotes, see page 59.
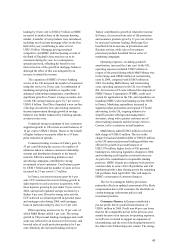
Basis of preparation
The results are presented in accordance with the
accounting policies used in the preparation of
HSBC’ s consolidated financial statements. HSBC’ s
operations are closely integrated and, accordingly,
the presentation of customer group data includes
internal allocations of certain items of income and
expense. These allocations include the costs of
certain support services and head office functions, to
the extent that these can be meaningfully attributed
to operational business lines. While such allocations
have been made on a systematic and consistent basis,
they necessarily involve a degree of subjectivity.
Where relevant, income and expense amounts
presented include the results of intra-segment
funding as well as inter-company and inter-business
line transactions. All such transactions are
undertaken on arm’s-length terms. Intra-segment
funding and placements of surplus funds are
generally undertaken at market interest rates.