HSBC 2004 Annual Report Download - page 263
Download and view the complete annual report
Please find page 263 of the 2004 HSBC annual report below. You can navigate through the pages in the report by either clicking on the pages listed below, or by using the keyword search tool below to find specific information within the annual report.-
 1
1 -
2
-
3
-
4
-
5
-
6
-
7
-
8
-
9
-
10
-
11
-
12
-
13
-
14
-
15
-
16
-
17
-
18
-
19
-
20
-
21
-
22
-
23
-
24
-
25
-
26
-
27
-
28
-
29
-
30
-
31
-
32
-
33
-
34
-
35
-
36
-
37
-
38
-
39
-
40
-
41
-
42
-
43
-
44
-
45
-
46
-
47
-
48
-
49
-
50
-
51
-
52
-
53
-
54
-
55
-
56
-
57
-
58
-
59
-
60
-
61
-
62
-
63
-
64
-
65
-
66
-
67
-
68
-
69
-
70
-
71
-
72
-
73
-
74
-
75
-
76
-
77
-
78
-
79
-
80
-
81
-
82
-
83
-
84
-
85
-
86
-
87
-
88
-
89
-
90
-
91
-
92
-
93
-
94
-
95
-
96
-
97
-
98
-
99
-
100
-
101
-
102
-
103
-
104
-
105
-
106
-
107
-
108
-
109
-
110
-
111
-
112
-
113
-
114
-
115
-
116
-
117
-
118
-
119
-
120
-
121
-
122
-
123
-
124
-
125
-
126
-
127
-
128
-
129
-
130
-
131
-
132
-
133
-
134
-
135
-
136
-
137
-
138
-
139
-
140
-
141
-
142
-
143
-
144
-
145
-
146
-
147
-
148
-
149
-
150
-
151
-
152
-
153
-
154
-
155
-
156
-
157
-
158
-
159
-
160
-
161
-
162
-
163
-
164
-
165
-
166
-
167
-
168
-
169
-
170
-
171
-
172
-
173
-
174
-
175
-
176
-
177
-
178
-
179
-
180
-
181
-
182
-
183
-
184
-
185
-
186
-
187
-
188
-
189
-
190
-
191
-
192
-
193
-
194
-
195
-
196
-
197
-
198
-
199
-
200
-
201
-
202
-
203
-
204
-
205
-
206
-
207
-
208
-
209
-
210
-
211
-
212
-
213
-
214
-
215
-
216
-
217
-
218
-
219
-
220
-
221
-
222
-
223
-
224
-
225
-
226
-
227
-
228
-
229
-
230
-
231
-
232
-
233
-
234
-
235
-
236
-
237
-
238
-
239
-
240
-
241
-
242
-
243
-
244
-
245
-
246
-
247
-
248
-
249
-
250
-
251
-
252
-
 253
253 -
 254
254 -
 255
255 -
 256
256 -
 257
257 -
 258
258 -
 259
259 -
 260
260 -
 261
261 -
 262
262 -
 263
263 -
 264
264 -
 265
265 -
 266
266 -
 267
267 -
 268
268 -
 269
269 -
 270
270 -
 271
271 -
 272
272 -
 273
273 -
274
-
275
-
276
-
277
-
278
-
279
-
280
-
281
-
282
-
283
-
284
-
285
-
286
-
287
-
288
-
289
-
290
-
291
-
292
-
293
-
294
-
295
-
296
-
297
-
298
-
299
-
300
-
301
-
302
-
303
-
304
-
305
-
306
-
307
-
308
-
309
-
310
-
311
-
312
-
313
-
314
-
315
-
316
-
317
-
318
-
319
-
320
-
321
-
322
-
323
-
324
-
325
-
326
-
327
-
328
-
329
-
330
-
331
-
332
-
333
-
334
-
335
-
336
-
337
-
338
-
339
-
340
-
341
-
342
-
343
-
344
-
345
-
346
-
347
-
348
-
349
-
350
-
351
-
352
-
353
-
354
-
355
-
356
-
357
-
358
-
359
-
360
-
361
-
362
-
363
-
364
-
365
-
366
-
367
-
368
-
369
-
370
-
371
-
372
-
373
-
374
-
375
-
376
-
377
-
378
 |
 |

261
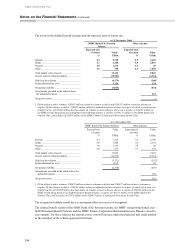
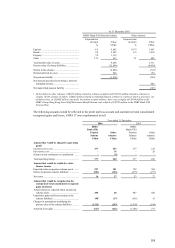
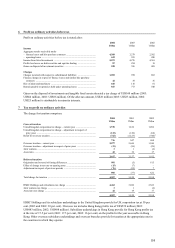
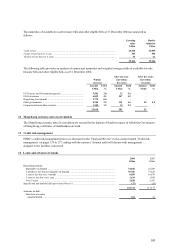
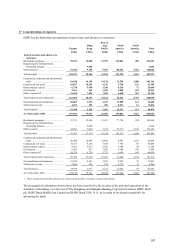
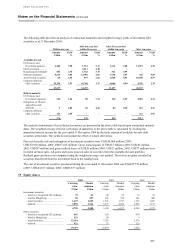
9 Dividends
2004 2003 2002
US$ per
share US$m
US$ per
share US$m
US$ per
share US$m
First interim ................................................. 0.130 1,425 0.240 2,596 0.205 1,932
Second interim ............................................. 0.130 1,436 0.120 1,309 0.325 3,069
Third interim ................................................ 0.130 1,444 0.240 2,627 – –
Fourth interim .............................................. 0.270 2,996 –– ––
0.660 7,301 0.600 6,532 0.530 5,001
Of the first, second and third interim dividends for 2004, US$747 million, US$746 million and US$255 million
respectively (2003: US$979 million, 2002: US$166 million) were settled by the issue of shares. Of the second and
third interim dividends for 2003, US$533 million and US$346 million respectively (2002: US$444 million, 2001:
US$857 million) were settled by the issue of shares in 2004.
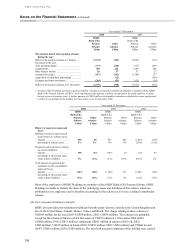
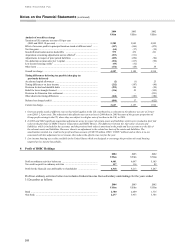
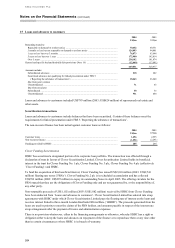
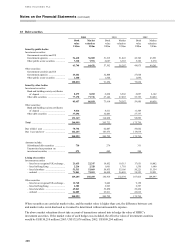
10 Earnings per ordinary share
Basic earnings per ordinary share was calculated by dividing the earnings of US$11,840 million (2003:
US$8,774 million, 2002: US$6,239 million) by the weighted average number of ordinary shares, excluding own
shares held, outstanding in 2004 of 10,907 million (2003: 10,421 million, 2002: 9,339 million).
Diluted earnings per share was calculated by dividing the basic earnings, which require no adjustment for the effects
of dilutive potential ordinary shares, by the weighted average number of ordinary shares outstanding, excluding own
shares held, plus the weighted average number of ordinary shares that would be issued on ordinary conversion of
dilutive potential ordinary shares (being share options outstanding not yet exercised) in 2004 of 11,054 million
(2003: 10,539 million, 2002: 9,436 million).
The effect of dilutive share options on the weighted average number of ordinary shares in issue is as follows:
Number of shares (millions)
2004 2003 2002
Average number of shares in issue ................................................................. 10,907 10,421 9,339
Savings-related Share Option Plan ................................................................. 38 30 30
Executive Share Option Scheme .................................................................... 12 811
Group Share Option Plan ............................................................................... 13 4–
Restricted Share Plan ..................................................................................... 63 56 38
CCF share options .......................................................................................... 13 14 18
HSBC Finance Corporation share options ..................................................... 86–
Average number of shares in issue assuming dilution ................................... 11,054 10,539 9,436
Of the total number of employee share options existing at 31 December 2004, 70 million were antidilutive (2003:
130 million, 2002: nil).
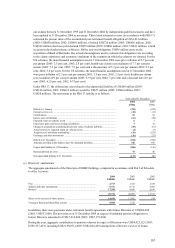
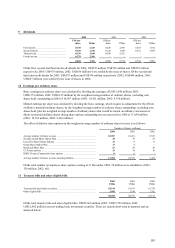
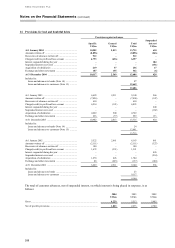
11 Treasury bills and other eligible bills
2004 2003 2002
US$m US$m US$m
Treasury bills and similar securities ............................................................... 29,194 19,193 16,759
Other eligible bills ......................................................................................... 1,090 1,198 1,382
30,284 20,391 18,141
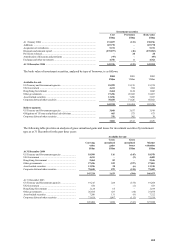
Of the total treasury bills and other eligible bills, US$25,666 million (2003: US$15,799 million, 2002:
US$12,902 million) are non-trading book investment securities. These are mainly short-term in maturity and are
analysed below.