HSBC 2004 Annual Report Download - page 319
Download and view the complete annual report
Please find page 319 of the 2004 HSBC annual report below. You can navigate through the pages in the report by either clicking on the pages listed below, or by using the keyword search tool below to find specific information within the annual report.-
 1
1 -
2
-
3
-
4
-
5
-
6
-
7
-
8
-
9
-
10
-
11
-
12
-
13
-
14
-
15
-
16
-
17
-
18
-
19
-
20
-
21
-
22
-
23
-
24
-
25
-
26
-
27
-
28
-
29
-
30
-
31
-
32
-
33
-
34
-
35
-
36
-
37
-
38
-
39
-
40
-
41
-
42
-
43
-
44
-
45
-
46
-
47
-
48
-
49
-
50
-
51
-
52
-
53
-
54
-
55
-
56
-
57
-
58
-
59
-
60
-
61
-
62
-
63
-
64
-
65
-
66
-
67
-
68
-
69
-
70
-
71
-
72
-
73
-
74
-
75
-
76
-
77
-
78
-
79
-
80
-
81
-
82
-
83
-
84
-
85
-
86
-
87
-
88
-
89
-
90
-
91
-
92
-
93
-
94
-
95
-
96
-
97
-
98
-
99
-
100
-
101
-
102
-
103
-
104
-
105
-
106
-
107
-
108
-
109
-
110
-
111
-
112
-
113
-
114
-
115
-
116
-
117
-
118
-
119
-
120
-
121
-
122
-
123
-
124
-
125
-
126
-
127
-
128
-
129
-
130
-
131
-
132
-
133
-
134
-
135
-
136
-
137
-
138
-
139
-
140
-
141
-
142
-
143
-
144
-
145
-
146
-
147
-
148
-
149
-
150
-
151
-
152
-
153
-
154
-
155
-
156
-
157
-
158
-
159
-
160
-
161
-
162
-
163
-
164
-
165
-
166
-
167
-
168
-
169
-
170
-
171
-
172
-
173
-
174
-
175
-
176
-
177
-
178
-
179
-
180
-
181
-
182
-
183
-
184
-
185
-
186
-
187
-
188
-
189
-
190
-
191
-
192
-
193
-
194
-
195
-
196
-
197
-
198
-
199
-
200
-
201
-
202
-
203
-
204
-
205
-
206
-
207
-
208
-
209
-
210
-
211
-
212
-
213
-
214
-
215
-
216
-
217
-
218
-
219
-
220
-
221
-
222
-
223
-
224
-
225
-
226
-
227
-
228
-
229
-
230
-
231
-
232
-
233
-
234
-
235
-
236
-
237
-
238
-
239
-
240
-
241
-
242
-
243
-
244
-
245
-
246
-
247
-
248
-
249
-
250
-
251
-
252
-
253
-
254
-
255
-
256
-
257
-
258
-
259
-
260
-
261
-
262
-
263
-
264
-
265
-
266
-
267
-
268
-
269
-
270
-
271
-
272
-
273
-
274
-
275
-
276
-
277
-
278
-
279
-
280
-
281
-
282
-
283
-
284
-
285
-
286
-
287
-
288
-
289
-
290
-
291
-
292
-
293
-
294
-
295
-
296
-
297
-
298
-
299
-
300
-
301
-
302
-
303
-
304
-
305
-
306
-
307
-
308
-
 309
309 -
 310
310 -
 311
311 -
 312
312 -
 313
313 -
 314
314 -
 315
315 -
 316
316 -
 317
317 -
 318
318 -
 319
319 -
 320
320 -
 321
321 -
 322
322 -
 323
323 -
 324
324 -
 325
325 -
 326
326 -
 327
327 -
 328
328 -
 329
329 -
330
-
331
-
332
-
333
-
334
-
335
-
336
-
337
-
338
-
339
-
340
-
341
-
342
-
343
-
344
-
345
-
346
-
347
-
348
-
349
-
350
-
351
-
352
-
353
-
354
-
355
-
356
-
357
-
358
-
359
-
360
-
361
-
362
-
363
-
364
-
365
-
366
-
367
-
368
-
369
-
370
-
371
-
372
-
373
-
374
-
375
-
376
-
377
-
378
 |
 |

317
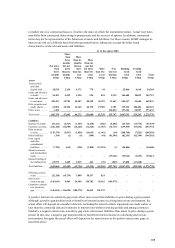
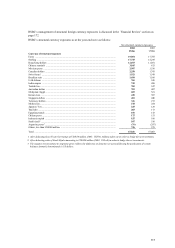
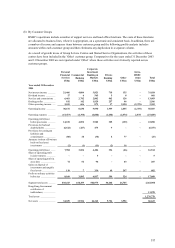
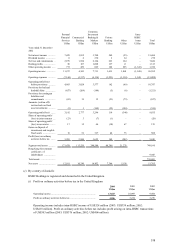
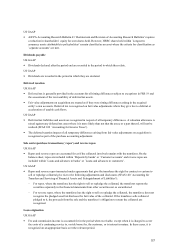
(b) By Customer Groups
HSBC’ s operations include a number of support services and head office functions. The costs of these functions
are allocated to business lines, where it is appropriate, on a systematic and consistent basis. In addition, there are
a number of income and expense items between customer group and the following profits analysis includes
amounts within each customer group and then eliminates any duplication in a separate column.
As a result of growth in use of Group Service Centres and Shared Service Organisations, the activities of these
centres have been included in the ‘Other’ customer group. Comparatives for the years ended 31 December 2003
and 31 December 2002 are not reported under ‘Other’ where these activities were formerly reported across
customer groups.
Personal
Financial
Services
C
ommercial
Banking
Corporate,
Investment
Banking &
Markets
Private
Banking Other
Intra-
HSBC
items Total
US$m US$m US$m US$m US$m US$m US$m
Year ended 31 December
2004
Net interest income ............. 21,466 4,884 3,821 718 135 – 31,024
Dividend income ................ 17 6 565 5 8 – 601
Net fees and commissions .. 6,461 2,742 2,802 962 126 – 13,093
Dealing profits .................... 192 142 1,929 257 46 – 2,566
Other operating income ..... 2,015 656 873 17 2,120 (2,378) 3,303
Operating income ............... 30,151 8,430 9,990 1,959 2,435 (2,378) 50,587
Operating expenses ............. (15,473) (4,378) (6,008) (1,634) (2,574) 2,378 (27,689)
Operating profit/(loss)
before provisions ............. 14,678 4,052 3,982 325 (139) – 22,898
Provisions for bad and
doubtful debts .................. (6,612) (227) 473 9 – – (6,357)
Provisions for contingent
liabilities and
commitments ................... (80) 10 (38) 4 77 – (27)
Amounts (written off)/written
back on fixed asset
investments ..................... (2) (1) (11) (2) 16 – –
Operating profit/(loss) ........ 7,984 3,834 4,406 336 (46) – 16,514
Share of operating profit
in joint ventures ............... ––5–––5
Share of operating profit in
associates ........................ 74 54 96 – 63 – 287
Gains on disposal of
investments and tangible
fixed assets....................... 110 7 330 48 307 – 802
Profit on ordinary activities
before tax ........................ 8,168 3,895 4,837 384 324 – 17,608
Segment total assets ............ 438,415 160,299 582,975 56,466 26,745 1,264,900
Hong Kong Government
certificates of
indebtedness .................... 11,878
Total assets ......................... 1,276,778
Net assets ............................ 34,659 13,924 24,362 9,726 3,952 86,623