HSBC 2004 Annual Report Download - page 143
Download and view the complete annual report
Please find page 143 of the 2004 HSBC annual report below. You can navigate through the pages in the report by either clicking on the pages listed below, or by using the keyword search tool below to find specific information within the annual report.-
 1
1 -
2
-
3
-
4
-
5
-
6
-
7
-
8
-
9
-
10
-
11
-
12
-
13
-
14
-
15
-
16
-
17
-
18
-
19
-
20
-
21
-
22
-
23
-
24
-
25
-
26
-
27
-
28
-
29
-
30
-
31
-
32
-
33
-
34
-
35
-
36
-
37
-
38
-
39
-
40
-
41
-
42
-
43
-
44
-
45
-
46
-
47
-
48
-
49
-
50
-
51
-
52
-
53
-
54
-
55
-
56
-
57
-
58
-
59
-
60
-
61
-
62
-
63
-
64
-
65
-
66
-
67
-
68
-
69
-
70
-
71
-
72
-
73
-
74
-
75
-
76
-
77
-
78
-
79
-
80
-
81
-
82
-
83
-
84
-
85
-
86
-
87
-
88
-
89
-
90
-
91
-
92
-
93
-
94
-
95
-
96
-
97
-
98
-
99
-
100
-
101
-
102
-
103
-
104
-
105
-
106
-
107
-
108
-
109
-
110
-
111
-
112
-
113
-
114
-
115
-
116
-
117
-
118
-
119
-
120
-
121
-
122
-
123
-
124
-
125
-
126
-
127
-
128
-
129
-
130
-
131
-
132
-
 133
133 -
 134
134 -
 135
135 -
 136
136 -
 137
137 -
 138
138 -
 139
139 -
 140
140 -
 141
141 -
 142
142 -
 143
143 -
 144
144 -
 145
145 -
 146
146 -
 147
147 -
 148
148 -
 149
149 -
 150
150 -
 151
151 -
 152
152 -
 153
153 -
154
-
155
-
156
-
157
-
158
-
159
-
160
-
161
-
162
-
163
-
164
-
165
-
166
-
167
-
168
-
169
-
170
-
171
-
172
-
173
-
174
-
175
-
176
-
177
-
178
-
179
-
180
-
181
-
182
-
183
-
184
-
185
-
186
-
187
-
188
-
189
-
190
-
191
-
192
-
193
-
194
-
195
-
196
-
197
-
198
-
199
-
200
-
201
-
202
-
203
-
204
-
205
-
206
-
207
-
208
-
209
-
210
-
211
-
212
-
213
-
214
-
215
-
216
-
217
-
218
-
219
-
220
-
221
-
222
-
223
-
224
-
225
-
226
-
227
-
228
-
229
-
230
-
231
-
232
-
233
-
234
-
235
-
236
-
237
-
238
-
239
-
240
-
241
-
242
-
243
-
244
-
245
-
246
-
247
-
248
-
249
-
250
-
251
-
252
-
253
-
254
-
255
-
256
-
257
-
258
-
259
-
260
-
261
-
262
-
263
-
264
-
265
-
266
-
267
-
268
-
269
-
270
-
271
-
272
-
273
-
274
-
275
-
276
-
277
-
278
-
279
-
280
-
281
-
282
-
283
-
284
-
285
-
286
-
287
-
288
-
289
-
290
-
291
-
292
-
293
-
294
-
295
-
296
-
297
-
298
-
299
-
300
-
301
-
302
-
303
-
304
-
305
-
306
-
307
-
308
-
309
-
310
-
311
-
312
-
313
-
314
-
315
-
316
-
317
-
318
-
319
-
320
-
321
-
322
-
323
-
324
-
325
-
326
-
327
-
328
-
329
-
330
-
331
-
332
-
333
-
334
-
335
-
336
-
337
-
338
-
339
-
340
-
341
-
342
-
343
-
344
-
345
-
346
-
347
-
348
-
349
-
350
-
351
-
352
-
353
-
354
-
355
-
356
-
357
-
358
-
359
-
360
-
361
-
362
-
363
-
364
-
365
-
366
-
367
-
368
-
369
-
370
-
371
-
372
-
373
-
374
-
375
-
376
-
377
-
378
 |
 |
141
The commentary below is on a constant currency
basis.
Residential mortgages increased by 28 per cent
to US$227.9 billion and comprised 33 per cent of
total gross loans to customers at 31 December 2004.
Growth was particularly strong in North America
where residential mortgages rose by 44 per cent to
US$112.9 billion. A combination of low
unemployment and low interest rates encouraged
both growth in new lending and the refinancing of
existing mortgages. HSBC Finance also introduced a
number of new products and activated a new
correspondent relationship in the first half of the
year. Residential mortgages in Europe increased by
26 per cent, predominantly in the UK, reflecting the
success of a number of marketing initiatives,
competitive pricing and continued buoyancy in the
housing market. Mortgage balances in Hong Kong
were marginally lower than in 2003 as a 14 per cent
fall in GHOS, which remained suspended during the
year, offset a small rise in non-scheme mortgages. In
the rest of Asia-Pacific, residential mortgages grew
by US$2.0 billion, or 16 per cent, with particularly
strong growth in China, the Middle East, India,
South Korea, Taiwan and Singapore.
Other personal lending, which represented 23
per cent of total gross loans to customers at
31 December 2004, increased by 17 per cent to
US$160.0 billion. Excluding the impact of the
acquisition of M&S Money in the UK in November
2004, the increase was 13 per cent. In Europe,
excluding this acquisition, other personal lending
grew by 18 per cent as consumer expenditure
remained strong, particularly in the UK, while
lending to European Private Banking clients rose by
22 per cent as customers took advantage of low
interest rates to finance higher returning securities.
Hong Kong and the rest of Asia-Pacific also
benefited from improved consumer sentiment and
other personal lending in Hong Kong increased by
23 per cent. In the rest of Asia-Pacific, an expansion
of consumer credit and growth in the credit cards
base contributed to a 25 per cent increase in other
personal lending while the US benefited from strong
growth in both the cards base and balances, and an
expansion of auto finance lending.
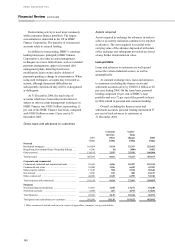
Loans and advances to the large corporate sector
remained subdued but commercial lending in Hong
Kong and in the rest of Asia-Pacific expanded as
regional trade volumes grew. International trade
balances in Hong Kong increased by 26 per cent to
US$7.8 billion, as economic expansion in mainland
China, and buoyant consumer spending in the US
encouraged business expansion. Inter-regional trade
volumes also grew across the rest of Asia-Pacific and
trade finance lending in the region increased by 30
per cent with particularly strong growth in the
Middle East, where oil producing countries benefited
from high global oil prices, Singapore, Korea and
Japan.
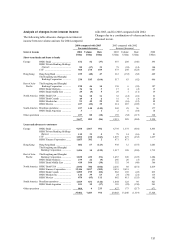
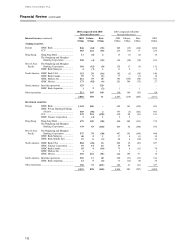
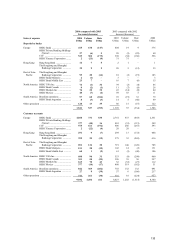
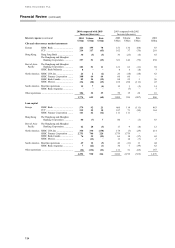
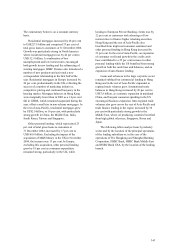
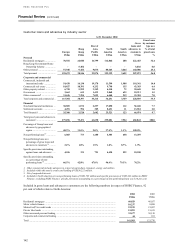
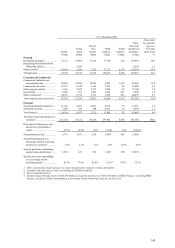
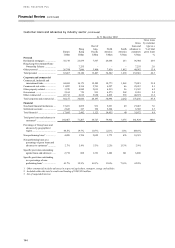
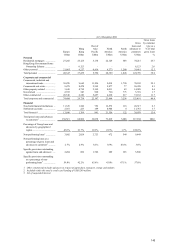
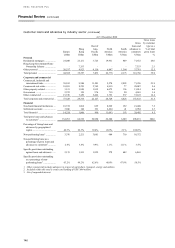
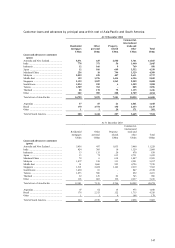
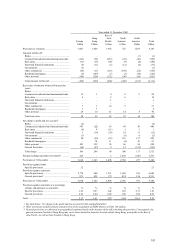
The following tables analyse loans by industry
sector and by the location of the principal operations
of the lending subsidiary or, in the case of the
operations of The Hongkong and Shanghai Banking
Corporation, HSBC Bank, HSBC Bank Middle East
and HSBC Bank USA, by the location of the lending
branch.