HSBC 2004 Annual Report Download - page 316
Download and view the complete annual report
Please find page 316 of the 2004 HSBC annual report below. You can navigate through the pages in the report by either clicking on the pages listed below, or by using the keyword search tool below to find specific information within the annual report.-
 1
1 -
2
-
3
-
4
-
5
-
6
-
7
-
8
-
9
-
10
-
11
-
12
-
13
-
14
-
15
-
16
-
17
-
18
-
19
-
20
-
21
-
22
-
23
-
24
-
25
-
26
-
27
-
28
-
29
-
30
-
31
-
32
-
33
-
34
-
35
-
36
-
37
-
38
-
39
-
40
-
41
-
42
-
43
-
44
-
45
-
46
-
47
-
48
-
49
-
50
-
51
-
52
-
53
-
54
-
55
-
56
-
57
-
58
-
59
-
60
-
61
-
62
-
63
-
64
-
65
-
66
-
67
-
68
-
69
-
70
-
71
-
72
-
73
-
74
-
75
-
76
-
77
-
78
-
79
-
80
-
81
-
82
-
83
-
84
-
85
-
86
-
87
-
88
-
89
-
90
-
91
-
92
-
93
-
94
-
95
-
96
-
97
-
98
-
99
-
100
-
101
-
102
-
103
-
104
-
105
-
106
-
107
-
108
-
109
-
110
-
111
-
112
-
113
-
114
-
115
-
116
-
117
-
118
-
119
-
120
-
121
-
122
-
123
-
124
-
125
-
126
-
127
-
128
-
129
-
130
-
131
-
132
-
133
-
134
-
135
-
136
-
137
-
138
-
139
-
140
-
141
-
142
-
143
-
144
-
145
-
146
-
147
-
148
-
149
-
150
-
151
-
152
-
153
-
154
-
155
-
156
-
157
-
158
-
159
-
160
-
161
-
162
-
163
-
164
-
165
-
166
-
167
-
168
-
169
-
170
-
171
-
172
-
173
-
174
-
175
-
176
-
177
-
178
-
179
-
180
-
181
-
182
-
183
-
184
-
185
-
186
-
187
-
188
-
189
-
190
-
191
-
192
-
193
-
194
-
195
-
196
-
197
-
198
-
199
-
200
-
201
-
202
-
203
-
204
-
205
-
206
-
207
-
208
-
209
-
210
-
211
-
212
-
213
-
214
-
215
-
216
-
217
-
218
-
219
-
220
-
221
-
222
-
223
-
224
-
225
-
226
-
227
-
228
-
229
-
230
-
231
-
232
-
233
-
234
-
235
-
236
-
237
-
238
-
239
-
240
-
241
-
242
-
243
-
244
-
245
-
246
-
247
-
248
-
249
-
250
-
251
-
252
-
253
-
254
-
255
-
256
-
257
-
258
-
259
-
260
-
261
-
262
-
263
-
264
-
265
-
266
-
267
-
268
-
269
-
270
-
271
-
272
-
273
-
274
-
275
-
276
-
277
-
278
-
279
-
280
-
281
-
282
-
283
-
284
-
285
-
286
-
287
-
288
-
289
-
290
-
291
-
292
-
293
-
294
-
295
-
296
-
297
-
298
-
299
-
300
-
301
-
302
-
303
-
304
-
305
-
 306
306 -
 307
307 -
 308
308 -
 309
309 -
 310
310 -
 311
311 -
 312
312 -
 313
313 -
 314
314 -
 315
315 -
 316
316 -
 317
317 -
 318
318 -
 319
319 -
 320
320 -
 321
321 -
 322
322 -
 323
323 -
 324
324 -
 325
325 -
 326
326 -
327
-
328
-
329
-
330
-
331
-
332
-
333
-
334
-
335
-
336
-
337
-
338
-
339
-
340
-
341
-
342
-
343
-
344
-
345
-
346
-
347
-
348
-
349
-
350
-
351
-
352
-
353
-
354
-
355
-
356
-
357
-
358
-
359
-
360
-
361
-
362
-
363
-
364
-
365
-
366
-
367
-
368
-
369
-
370
-
371
-
372
-
373
-
374
-
375
-
376
-
377
-
378
 |
 |

HSBC HOLDINGS PLC
Notes on the Financial Statements (continued)
314
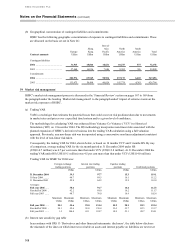
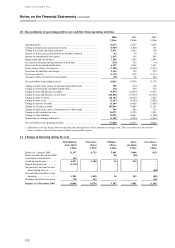
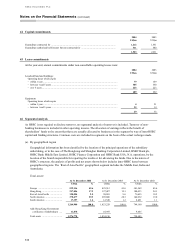
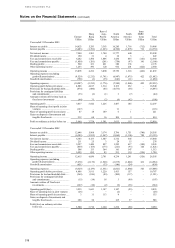
44 Capital commitments
2004 2003
US$m US$m
Expenditure contracted for ........................................................................................................... 1,212 1,551
Expenditure authorised by Directors but not contracted for ......................................................... 311 680
1,523 2,231
45 Lease commitments
At the year-end, annual commitments under non-cancellable operating leases were:
2004 2003
US$m US$m
Leasehold land and buildings:
Operating leases which expire
– within 1 year ............................................................................................................................ 79 109
– between 1 and 5 years.............................................................................................................. 305 360
– over 5 years.............................................................................................................................. 225 223
609 692
Equipment:
Operating leases which expire
– within 1 year ............................................................................................................................ 421
– between 1 and 5 years.............................................................................................................. 25 14
29 35
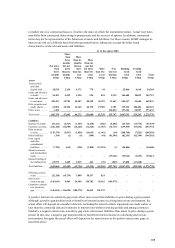
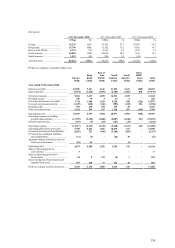
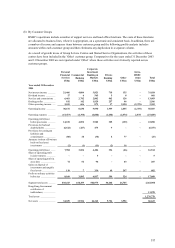
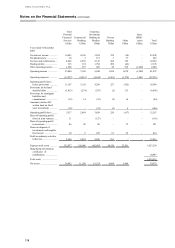
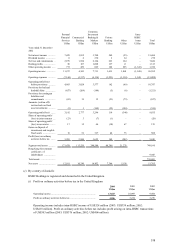
46 Segmental analysis
As HSBC is not required to disclose turnover, no segmental analysis of turnover is included. Turnover of non-
banking businesses is included in other operating income. The allocation of earnings reflects the benefit of
shareholders’ funds to the extent that these are actually allocated to businesses in the segment by way of intra-HSBC
capital and funding structures. Common costs are included in segments on the basis of the actual recharges made.
(a) By geographical region
Geographical information has been classified by the location of the principal operations of the subsidiary
undertaking, or in the case of The Hongkong and Shanghai Banking Corporation Limited, HSBC Bank plc,
HSBC Bank Middle East Limited, HSBC Finance Corporation and HSBC Bank USA, N.A. operations, by the
location of the branch responsible for reporting the results or for advancing the funds. Due to the nature of
HSBC’ s structure, the analysis of profits and net assets shown below includes intra-HSBC items between
geographical regions. The ‘Rest of Asia-Pacific’ geographical segment includes the Middle East, India and
Australasia.
Total assets:
At 31 December 2004 At 31 December 2003 At 31 December 2002
US$m % US$m % US$m %
Europe ........................................ 539,116 42.6 425,312 41.6 341,569 45.6
Hong Kong ................................. 217,406 17.2 197,487 19.3 180,433 24.1
Rest of Asia-Pacific .................... 120,504 9.5 98,081 9.6 76,635 10.2
North America ............................ 370,477 29.3 289,800 28.3 142,032 19.0
South America ............................ 17,397 1.4 12,549 1.2 8,491 1.1
1,264,900 100.0 1,023,229 100.0 749,160 100.0
Add: Hong Kong Government
certificates of indebtedness ..... 11,878 10,987 9,445
Total assets ................................. 1,276,778 1,034,216 758,605