HSBC 2004 Annual Report Download - page 160
Download and view the complete annual report
Please find page 160 of the 2004 HSBC annual report below. You can navigate through the pages in the report by either clicking on the pages listed below, or by using the keyword search tool below to find specific information within the annual report.-
 1
1 -
 2
2 -
 3
3 -
 4
4 -
 5
5 -
 6
6 -
 7
7 -
 8
8 -
 9
9 -
 10
10 -
 11
11 -
 12
12 -
 13
13 -
 14
14 -
 15
15 -
 16
16 -
 17
17 -
 18
18 -
 19
19 -
 20
20 -
 21
21 -
 22
22 -
 23
23 -
 24
24 -
 25
25 -
 26
26 -
 27
27 -
 28
28 -
 29
29 -
 30
30 -
 31
31 -
 32
32 -
 33
33 -
 34
34 -
 35
35 -
 36
36 -
 37
37 -
 38
38 -
 39
39 -
 40
40 -
 41
41 -
 42
42 -
 43
43 -
 44
44 -
 45
45 -
 46
46 -
 47
47 -
 48
48 -
 49
49 -
 50
50 -
 51
51 -
 52
52 -
 53
53 -
 54
54 -
 55
55 -
 56
56 -
 57
57 -
 58
58 -
 59
59 -
 60
60 -
 61
61 -
 62
62 -
 63
63 -
 64
64 -
 65
65 -
 66
66 -
 67
67 -
 68
68 -
 69
69 -
 70
70 -
 71
71 -
 72
72 -
 73
73 -
 74
74 -
 75
75 -
 76
76 -
 77
77 -
 78
78 -
 79
79 -
 80
80 -
 81
81 -
 82
82 -
 83
83 -
 84
84 -
 85
85 -
 86
86 -
 87
87 -
 88
88 -
 89
89 -
 90
90 -
 91
91 -
 92
92 -
 93
93 -
 94
94 -
 95
95 -
 96
96 -
 97
97 -
 98
98 -
 99
99 -
 100
100 -
 101
101 -
 102
102 -
 103
103 -
 104
104 -
 105
105 -
 106
106 -
 107
107 -
 108
108 -
 109
109 -
 110
110 -
 111
111 -
 112
112 -
 113
113 -
 114
114 -
 115
115 -
 116
116 -
 117
117 -
 118
118 -
 119
119 -
 120
120 -
 121
121 -
 122
122 -
 123
123 -
 124
124 -
 125
125 -
 126
126 -
 127
127 -
 128
128 -
 129
129 -
 130
130 -
 131
131 -
 132
132 -
 133
133 -
 134
134 -
 135
135 -
 136
136 -
 137
137 -
 138
138 -
 139
139 -
 140
140 -
 141
141 -
 142
142 -
 143
143 -
 144
144 -
 145
145 -
 146
146 -
 147
147 -
 148
148 -
 149
149 -
 150
150 -
 151
151 -
 152
152 -
 153
153 -
 154
154 -
 155
155 -
 156
156 -
 157
157 -
 158
158 -
 159
159 -
 160
160 -
 161
161 -
 162
162 -
 163
163 -
 164
164 -
 165
165 -
 166
166 -
 167
167 -
 168
168 -
 169
169 -
 170
170 -
 171
171 -
 172
172 -
 173
173 -
 174
174 -
 175
175 -
 176
176 -
 177
177 -
 178
178 -
 179
179 -
 180
180 -
 181
181 -
 182
182 -
 183
183 -
 184
184 -
 185
185 -
 186
186 -
 187
187 -
 188
188 -
 189
189 -
 190
190 -
 191
191 -
 192
192 -
 193
193 -
 194
194 -
 195
195 -
 196
196 -
 197
197 -
 198
198 -
 199
199 -
 200
200 -
 201
201 -
 202
202 -
 203
203 -
 204
204 -
 205
205 -
 206
206 -
 207
207 -
 208
208 -
 209
209 -
 210
210 -
 211
211 -
 212
212 -
 213
213 -
 214
214 -
 215
215 -
 216
216 -
 217
217 -
 218
218 -
 219
219 -
 220
220 -
 221
221 -
 222
222 -
 223
223 -
 224
224 -
 225
225 -
 226
226 -
 227
227 -
 228
228 -
 229
229 -
 230
230 -
 231
231 -
 232
232 -
 233
233 -
 234
234 -
 235
235 -
 236
236 -
 237
237 -
 238
238 -
 239
239 -
 240
240 -
 241
241 -
 242
242 -
 243
243 -
 244
244 -
 245
245 -
 246
246 -
 247
247 -
 248
248 -
 249
249 -
 250
250 -
 251
251 -
 252
252 -
 253
253 -
 254
254 -
 255
255 -
 256
256 -
 257
257 -
 258
258 -
 259
259 -
 260
260 -
 261
261 -
 262
262 -
 263
263 -
 264
264 -
 265
265 -
 266
266 -
 267
267 -
 268
268 -
 269
269 -
 270
270 -
 271
271 -
 272
272 -
 273
273 -
 274
274 -
 275
275 -
 276
276 -
 277
277 -
 278
278 -
 279
279 -
 280
280 -
 281
281 -
 282
282 -
 283
283 -
 284
284 -
 285
285 -
 286
286 -
 287
287 -
 288
288 -
 289
289 -
 290
290 -
 291
291 -
 292
292 -
 293
293 -
 294
294 -
 295
295 -
 296
296 -
 297
297 -
 298
298 -
 299
299 -
 300
300 -
 301
301 -
 302
302 -
 303
303 -
 304
304 -
 305
305 -
 306
306 -
 307
307 -
 308
308 -
 309
309 -
 310
310 -
 311
311 -
 312
312 -
 313
313 -
 314
314 -
 315
315 -
 316
316 -
 317
317 -
 318
318 -
 319
319 -
 320
320 -
 321
321 -
 322
322 -
 323
323 -
 324
324 -
 325
325 -
 326
326 -
 327
327 -
 328
328 -
 329
329 -
 330
330 -
 331
331 -
 332
332 -
 333
333 -
 334
334 -
 335
335 -
 336
336 -
 337
337 -
 338
338 -
 339
339 -
 340
340 -
 341
341 -
 342
342 -
 343
343 -
 344
344 -
 345
345 -
 346
346 -
 347
347 -
 348
348 -
 349
349 -
 350
350 -
 351
351 -
 352
352 -
 353
353 -
 354
354 -
 355
355 -
 356
356 -
 357
357 -
 358
358 -
 359
359 -
 360
360 -
 361
361 -
 362
362 -
 363
363 -
 364
364 -
 365
365 -
 366
366 -
 367
367 -
 368
368 -
 369
369 -
 370
370 -
 371
371 -
 372
372 -
 373
373 -
 374
374 -
 375
375 -
 376
376 -
 377
377 -
 378
378
 |
 |

HSBC HOLDINGS PLC
Financial Review (continued)
158
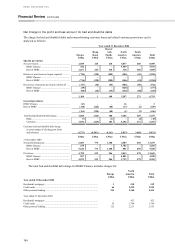
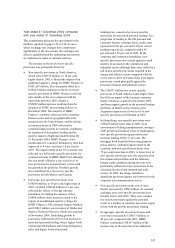
quarter, improved collections and the sales of
charged-off accounts. In Europe, excluding
HSBC Finance, releases and recoveries were
US$344 million higher, of which US$51 million
arose from currency translation effects. At
constant currencies, the increase reflected
releases of provisions in the energy, utilities and
petroleum sectors in the UK and manufacturing
and transport equipment sectors in France, while
recoveries benefited from the sale in the
secondary market of loans to a borrower in the
engineering sector. In North America, excluding
HSBC Finance, releases and recoveries
increased by US$126 million. The improvement
reflected an ongoing workout programme to
reduce the legacy bad debt portfolio in Mexico,
higher repayments of previously non-
performing loans in the US and the sale of
impaired loans in the US secondary market. In
Hong Kong, the benign credit environment and
rising house prices contributed to a rise in
releases and recoveries for residential
mortgages. This offset a general fall in the levels
of releases and recoveries in the Hong Kong
commercial sector that was also evident across
the Rest of Asia-Pacific. The sharp increase in
releases and recoveries in South America largely
reflected the inclusion of the Losango consumer
lending business and organic growth in Brazil,
together with successful collections activities in
Argentina.
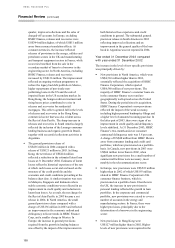
• The general provision release of
US$436 million in 2004 compared with a
release of US$121 million in 2003. In Hong
Kong, the net release of US$224 million
reflected a reduction in the estimated latent loan
losses at 31 December 2004. Estimates of latent
losses reflect the historical experience of the rate
at which such losses occur and are based on the
structure of the credit portfolio and the
economic and credit conditions prevailing at the
balance sheet date. A similar situation was seen
in Malaysia, Singapore and Indonesia where
stable economic conditions were reflected in an
improvement in credit quality and reduction in
latent loan losses. As a result, the net charge for
the Rest of Asia-Pacific in 2003 became a net
release in 2004. In North America, the small
general provision release compared with a
charge of US$136 million in 2003 and reflected
an improvement in the economic outlook and
delinquency roll-rate trends in HSBC Finance
Corp, and a smaller charge in Mexico. In
Europe, the increase in general provisions
required from the growth in lending balances
was offset by the impact of the improvement in
both historical loss experience and credit
conditions in general. The substantial general
provision release in South America in 2003
reflecting improved collections and an
improvement in the general quality of the loan
book in Argentina was not repeated in 2004.
Year ended 31 December 2003 compared
with year ended 31 December 2002
The increase in the level of new specific provisions
was principally driven by:
• New provisions in North America, which were
US$4,563 million higher than in 2002,
essentially reflected the acquisition of HSBC
Finance Corporation, which reported
US$4,580 million of new provisions. The
majority of HSBC Finance’ s customer loans are
in the consumer finance sector and are
geographically well-spread across the United
States. During the period since its acquisition,
HSBC Finance Corporation’ s new provisions
reflected the impact of the weak economy,
including higher personal bankruptcy filings and
a higher level of amounts becoming past due. In
the latter part of 2003, there were signs of an
improvement in credit quality and delinquency
levels stabilised. At 31 December 2003, HSBC
Finance’ s two-month-and-over consumer
contractual delinquency ratio was 5.8 per cent.
A charge of US$48 million from HSBC Mexico
arose from consumer lending and credit card
portfolios, which are provisioned on a portfolio
basis. In Canada, new provisions in 2003 were
US$66 million lower than in 2002, when
significant new provisions for a small number of
commercial facilities were necessary, most
notably in the telecommunications sector.
• In Europe, new provisions were US$522 million
higher than in 2002 of which US$193 million
related to HSBC Finance Corporation’s UK
consumer finance business, which is
provisioned on a portfolio basis. Elsewhere in
the UK, the increase in new provisions in
personal lending reflected the growth in loan
portfolios. In the corporate and commercial
portfolio, new provisions were raised to cover a
number of accounts in the energy and
manufacturing sectors. In France, there were
higher provisions, principally due to the
deterioration of a borrower in the engineering
sector.
• New provisions in Hong Kong were
US$127 million higher than in 2002. Higher
levels of new provisions were required in the
