HSBC 2004 Annual Report Download - page 55
Download and view the complete annual report
Please find page 55 of the 2004 HSBC annual report below. You can navigate through the pages in the report by either clicking on the pages listed below, or by using the keyword search tool below to find specific information within the annual report.-
 1
1 -
2
-
3
-
4
-
5
-
6
-
7
-
8
-
9
-
10
-
11
-
12
-
13
-
14
-
15
-
16
-
17
-
18
-
19
-
20
-
21
-
22
-
23
-
24
-
25
-
26
-
27
-
28
-
29
-
30
-
31
-
32
-
33
-
34
-
35
-
36
-
37
-
38
-
39
-
40
-
41
-
42
-
43
-
44
-
 45
45 -
 46
46 -
 47
47 -
 48
48 -
 49
49 -
 50
50 -
 51
51 -
 52
52 -
 53
53 -
 54
54 -
 55
55 -
 56
56 -
 57
57 -
 58
58 -
 59
59 -
 60
60 -
 61
61 -
 62
62 -
 63
63 -
 64
64 -
 65
65 -
66
-
67
-
68
-
69
-
70
-
71
-
72
-
73
-
74
-
75
-
76
-
77
-
78
-
79
-
80
-
81
-
82
-
83
-
84
-
85
-
86
-
87
-
88
-
89
-
90
-
91
-
92
-
93
-
94
-
95
-
96
-
97
-
98
-
99
-
100
-
101
-
102
-
103
-
104
-
105
-
106
-
107
-
108
-
109
-
110
-
111
-
112
-
113
-
114
-
115
-
116
-
117
-
118
-
119
-
120
-
121
-
122
-
123
-
124
-
125
-
126
-
127
-
128
-
129
-
130
-
131
-
132
-
133
-
134
-
135
-
136
-
137
-
138
-
139
-
140
-
141
-
142
-
143
-
144
-
145
-
146
-
147
-
148
-
149
-
150
-
151
-
152
-
153
-
154
-
155
-
156
-
157
-
158
-
159
-
160
-
161
-
162
-
163
-
164
-
165
-
166
-
167
-
168
-
169
-
170
-
171
-
172
-
173
-
174
-
175
-
176
-
177
-
178
-
179
-
180
-
181
-
182
-
183
-
184
-
185
-
186
-
187
-
188
-
189
-
190
-
191
-
192
-
193
-
194
-
195
-
196
-
197
-
198
-
199
-
200
-
201
-
202
-
203
-
204
-
205
-
206
-
207
-
208
-
209
-
210
-
211
-
212
-
213
-
214
-
215
-
216
-
217
-
218
-
219
-
220
-
221
-
222
-
223
-
224
-
225
-
226
-
227
-
228
-
229
-
230
-
231
-
232
-
233
-
234
-
235
-
236
-
237
-
238
-
239
-
240
-
241
-
242
-
243
-
244
-
245
-
246
-
247
-
248
-
249
-
250
-
251
-
252
-
253
-
254
-
255
-
256
-
257
-
258
-
259
-
260
-
261
-
262
-
263
-
264
-
265
-
266
-
267
-
268
-
269
-
270
-
271
-
272
-
273
-
274
-
275
-
276
-
277
-
278
-
279
-
280
-
281
-
282
-
283
-
284
-
285
-
286
-
287
-
288
-
289
-
290
-
291
-
292
-
293
-
294
-
295
-
296
-
297
-
298
-
299
-
300
-
301
-
302
-
303
-
304
-
305
-
306
-
307
-
308
-
309
-
310
-
311
-
312
-
313
-
314
-
315
-
316
-
317
-
318
-
319
-
320
-
321
-
322
-
323
-
324
-
325
-
326
-
327
-
328
-
329
-
330
-
331
-
332
-
333
-
334
-
335
-
336
-
337
-
338
-
339
-
340
-
341
-
342
-
343
-
344
-
345
-
346
-
347
-
348
-
349
-
350
-
351
-
352
-
353
-
354
-
355
-
356
-
357
-
358
-
359
-
360
-
361
-
362
-
363
-
364
-
365
-
366
-
367
-
368
-
369
-
370
-
371
-
372
-
373
-
374
-
375
-
376
-
377
-
378
 |
 |

53
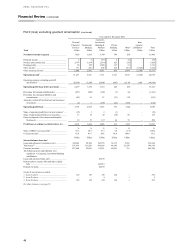
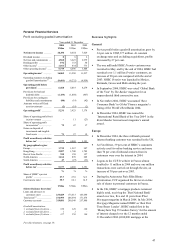
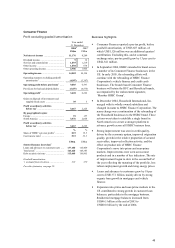
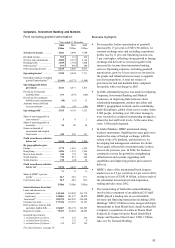
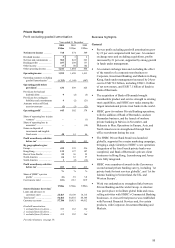
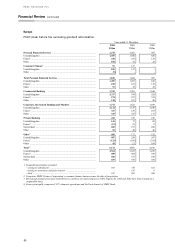
Corporate, Investment Banking and Markets
Profit excluding goodwill amortisation Business highlights
Year ended 31 December
2004 2003 2002
US$m US$m US$m
Net interest income ............ 3,821 3,899 3,700
Dividend income .................. 565 161 230
Net fees and commissions .... 2,802 2,315 2,164
Dealing profits ..................... 1,929 1,764 1,008
Other income9 ...................... 873 805 609
Other operating income9 ...... 6,169 5,045 4,011
Operating income9 ............. 9,990 8,944 7,711
Operating expenses excluding
goodwill amortisation1,9 ... (5,649) (4,373) (3,898)
Operating profit before
provisions1....................... 4,341 4,571 3,813
Provisions for bad and
doubtful debts .................. 473 (297) (184)
Provisions for contingent
liabilities and commitments (38) (53) 12
Amounts written off fixed
asset investments ............. (11) (91) (109)
Operating profit1 ................ 4,765 4,130 3,532
Share of operating profit in
joint ventures2 .................. 582
Share of operating profit in
associates ......................... 96 80 45
Gains on disposal of
investments and tangible
fixed assets ...................... 330 225 317
Profit on ordinary activities
before tax3 ....................... 5,196 4,443 3,896
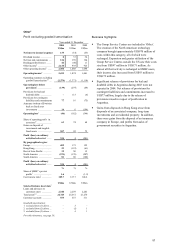
By geographical region:
Europe .................................. 1,772 1,623 1,438
Hong Kong ........................... 1,584 1,275 1,226
Rest of Asia-Pacific ............. 940 732 706
North America ..................... 750 837 494
South America ..................... 150 (24) 32
Profit on ordinary activities
before tax3 ....................... 5,196 4,443 3,896
%%%
Share of HSBC’ s pre-tax
profits3 ............................. 26.7 30.9 37.1
Cost:income ratio1 ................ 56.5 48.9 50.6
US$m US$m US$m
Selected balance sheet data7
Loans and advances to:
– customers (net) .................. 142,160 115,092 101,770
– banks (net) ........................ 128,001 101,277 80,870
Total assets8,9 ........................ 582,975 462,995 394,540
Customer accounts ............... 177,936 119,335 95,351
Debt securities, treasury bills
and other eligible bills ...... 234,867 186,139 162,583
Deposits by banks ................ 79,927 65,882 48,895
Goodwill amortisation:
1excluded from (1) above ... 359 272 236
2excluded from (2) above ... –135 8
3excluded from (3) above ... 359 407 244
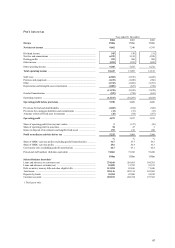
• Pre-tax profits, before amortisation of goodwill,
increased by 17 per cent, to US$5,196 million. At
constant exchange rates and excluding acquisitions,
profits rose by 11 per cent. Operating income was
3 per cent higher, reflecting strong growth in foreign
exchange and derivatives revenues together with
increased fee income from transaction banking
services. Operating expenses, excluding goodwill
amortisation, grew by 16 per cent as we invested in
the people and infrastructure necessary to upgrade
our client proposition. A total net release of
provisions for bad and doubtful debts compared
favourably with a net charge in 2003.
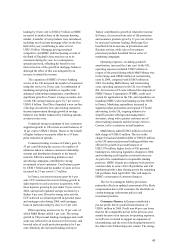
• In 2004, substantial progress was made in realigning
Corporate, Investment Banking and Markets’
businesses, in improving links between client
relationship management, product specialists and
HSBC’ s geographical network, and in establishing
multi-disciplinary, global client service teams. Some
2,000 people, including over 100 senior managers,
were recruited in a planned restructuring designed to
attract the best staff at all levels. At the same time,
some 1,500 people departed.
• In Global Markets, HSBC maintained strong
business momentum. Significant revenue gains were
made in the areas of foreign exchange, with the
rollout of the eFX platform, and derivatives, by
developing risk management solutions for clients.
These gains reflected the investment made in these
areas in the previous year. In 2004, the business
continued to invest for growth by strengthening
infrastructure and systems, upgrading staff
capabilities and improving product and customer
delivery.
• HSBC’ s share of the international bond issuance
market rose to 4.9 per cent from 4.4 per cent in 2003,
raising in excess of US$114 billion, a direct result of
the substantial investment in bond origination,
trading and sales since 2002.
• The restructuring of Global Investment Banking
involved the recruitment of an additional 215 staff.
HSBC played a leading role in several notable
advisory and financing transactions including LNM
Holdings’ US$17.0 billion reverse merger with Ispat
International to form Mittal Steel; Saudi Arabian Oil
Company’ s acquisition of a stake in Showa Shell
Sekiyu K.K. (Japan) from the Royal Dutch/Shell
Group; and Neptune Orient Lines’ US$1.7 billion
take-over by Temasek Holding.
For other footnotes, see page 59.