HSBC 2004 Annual Report Download - page 264
Download and view the complete annual report
Please find page 264 of the 2004 HSBC annual report below. You can navigate through the pages in the report by either clicking on the pages listed below, or by using the keyword search tool below to find specific information within the annual report.-
 1
1 -
2
-
3
-
4
-
5
-
6
-
7
-
8
-
9
-
10
-
11
-
12
-
13
-
14
-
15
-
16
-
17
-
18
-
19
-
20
-
21
-
22
-
23
-
24
-
25
-
26
-
27
-
28
-
29
-
30
-
31
-
32
-
33
-
34
-
35
-
36
-
37
-
38
-
39
-
40
-
41
-
42
-
43
-
44
-
45
-
46
-
47
-
48
-
49
-
50
-
51
-
52
-
53
-
54
-
55
-
56
-
57
-
58
-
59
-
60
-
61
-
62
-
63
-
64
-
65
-
66
-
67
-
68
-
69
-
70
-
71
-
72
-
73
-
74
-
75
-
76
-
77
-
78
-
79
-
80
-
81
-
82
-
83
-
84
-
85
-
86
-
87
-
88
-
89
-
90
-
91
-
92
-
93
-
94
-
95
-
96
-
97
-
98
-
99
-
100
-
101
-
102
-
103
-
104
-
105
-
106
-
107
-
108
-
109
-
110
-
111
-
112
-
113
-
114
-
115
-
116
-
117
-
118
-
119
-
120
-
121
-
122
-
123
-
124
-
125
-
126
-
127
-
128
-
129
-
130
-
131
-
132
-
133
-
134
-
135
-
136
-
137
-
138
-
139
-
140
-
141
-
142
-
143
-
144
-
145
-
146
-
147
-
148
-
149
-
150
-
151
-
152
-
153
-
154
-
155
-
156
-
157
-
158
-
159
-
160
-
161
-
162
-
163
-
164
-
165
-
166
-
167
-
168
-
169
-
170
-
171
-
172
-
173
-
174
-
175
-
176
-
177
-
178
-
179
-
180
-
181
-
182
-
183
-
184
-
185
-
186
-
187
-
188
-
189
-
190
-
191
-
192
-
193
-
194
-
195
-
196
-
197
-
198
-
199
-
200
-
201
-
202
-
203
-
204
-
205
-
206
-
207
-
208
-
209
-
210
-
211
-
212
-
213
-
214
-
215
-
216
-
217
-
218
-
219
-
220
-
221
-
222
-
223
-
224
-
225
-
226
-
227
-
228
-
229
-
230
-
231
-
232
-
233
-
234
-
235
-
236
-
237
-
238
-
239
-
240
-
241
-
242
-
243
-
244
-
245
-
246
-
247
-
248
-
249
-
250
-
251
-
252
-
253
-
 254
254 -
 255
255 -
 256
256 -
 257
257 -
 258
258 -
 259
259 -
 260
260 -
 261
261 -
 262
262 -
 263
263 -
 264
264 -
 265
265 -
 266
266 -
 267
267 -
 268
268 -
 269
269 -
 270
270 -
 271
271 -
 272
272 -
 273
273 -
 274
274 -
275
-
276
-
277
-
278
-
279
-
280
-
281
-
282
-
283
-
284
-
285
-
286
-
287
-
288
-
289
-
290
-
291
-
292
-
293
-
294
-
295
-
296
-
297
-
298
-
299
-
300
-
301
-
302
-
303
-
304
-
305
-
306
-
307
-
308
-
309
-
310
-
311
-
312
-
313
-
314
-
315
-
316
-
317
-
318
-
319
-
320
-
321
-
322
-
323
-
324
-
325
-
326
-
327
-
328
-
329
-
330
-
331
-
332
-
333
-
334
-
335
-
336
-
337
-
338
-
339
-
340
-
341
-
342
-
343
-
344
-
345
-
346
-
347
-
348
-
349
-
350
-
351
-
352
-
353
-
354
-
355
-
356
-
357
-
358
-
359
-
360
-
361
-
362
-
363
-
364
-
365
-
366
-
367
-
368
-
369
-
370
-
371
-
372
-
373
-
374
-
375
-
376
-
377
-
378
 |
 |

HSBC HOLDINGS PLC
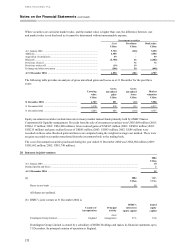
Notes on the Financial Statements (continued)
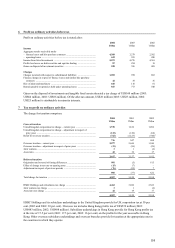
262
Cost and
book value
US$m
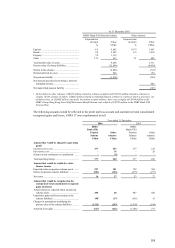
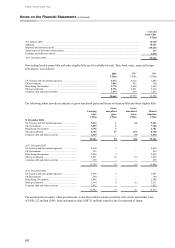
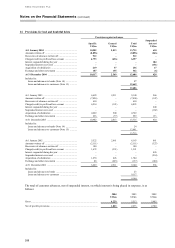
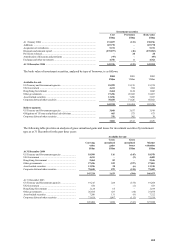
At 1 January 2004 ............................................................................................................................................................... 15,799
Additions ............................................................................................................................................................................. 78,751
Disposals and amounts repaid ............................................................................................................................................. (70,221)
Amortisation of discounts and premiums ............................................................................................................................ 317
Exchange and other movements .......................................................................................................................................... 1,020
At 31 December 2004 ......................................................................................................................................................... 25,666
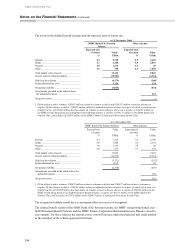
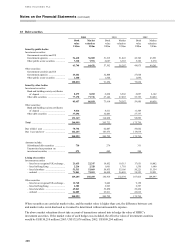
Non-trading book treasury bills and other eligible bills are all available-for-sale. Their book value, analysed by type
of borrower, is as follows:
2004 2003 2002
US$m US$m US$m
US Treasury and Government agencies ......................................................... 5,514 4,624 2,888
UK Government ............................................................................................. 7,099 955 740
Hong Kong Government ................................................................................ 2,778 2,450 2,898
Other governments ......................................................................................... 8,756 6,891 5,344
Corporate debt and other securities ................................................................ 1,519 879 1,032
25,666 15,799 12,902
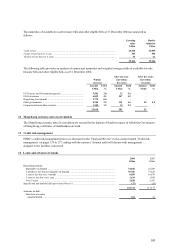
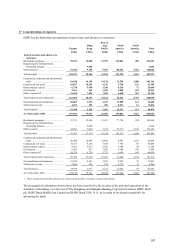
The following tables provide an analysis of gross unrealised gains and losses on treasury bills and other eligible bills:
Carrying
value
Gross
unrealised
gains
Gross
unrealised
losses
Market
valuation
US$m US$m US$m US$m
31 December 2004
US Treasury and Government agencies ....................... 5,514 1 (4) 5,511
UK Government ........................................................... 7,099 1 – 7,100
Hong Kong Government .............................................. 2,778 3 – 2,781
Other governments ....................................................... 8,756 15 (13) 8,758
Corporate debt and other securities .............................. 1,519 – (3) 1,516
25,666 20 (20) 25,666
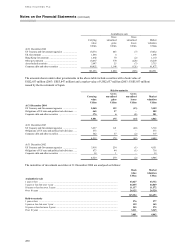
At 31 December 2003
US Treasury and Government agencies ....................... 4,624 2 – 4,626
UK Government ........................................................... 955 – – 955
Hong Kong Government .............................................. 2,450 2 – 2,452
Other governments ....................................................... 6,891 10 (5) 6,896
Corporate debt and other securities .............................. 879 – – 879
15,799 14 (5) 15,808
At 31 December 2002
US Treasury and Government agencies ....................... 2,888 3 – 2,891
UK Government ........................................................... 740 – – 740
Hong Kong Government .............................................. 2,898 2 – 2,900
Other governments ....................................................... 5,344 8 (1) 5,351
Corporate debt and other securities .............................. 1,032 – – 1,032
12,902 13 (1) 12,914
The amounts shown under ‘other governments’ in the above table includes securities with a book and market value
of US$1,122 million (2003: book and market value US$711 million) issued by the Government of Japan.