HSBC 2004 Annual Report Download - page 336
Download and view the complete annual report
Please find page 336 of the 2004 HSBC annual report below. You can navigate through the pages in the report by either clicking on the pages listed below, or by using the keyword search tool below to find specific information within the annual report.-
 1
1 -
2
-
3
-
4
-
5
-
6
-
7
-
8
-
9
-
10
-
11
-
12
-
13
-
14
-
15
-
16
-
17
-
18
-
19
-
20
-
21
-
22
-
23
-
24
-
25
-
26
-
27
-
28
-
29
-
30
-
31
-
32
-
33
-
34
-
35
-
36
-
37
-
38
-
39
-
40
-
41
-
42
-
43
-
44
-
45
-
46
-
47
-
48
-
49
-
50
-
51
-
52
-
53
-
54
-
55
-
56
-
57
-
58
-
59
-
60
-
61
-
62
-
63
-
64
-
65
-
66
-
67
-
68
-
69
-
70
-
71
-
72
-
73
-
74
-
75
-
76
-
77
-
78
-
79
-
80
-
81
-
82
-
83
-
84
-
85
-
86
-
87
-
88
-
89
-
90
-
91
-
92
-
93
-
94
-
95
-
96
-
97
-
98
-
99
-
100
-
101
-
102
-
103
-
104
-
105
-
106
-
107
-
108
-
109
-
110
-
111
-
112
-
113
-
114
-
115
-
116
-
117
-
118
-
119
-
120
-
121
-
122
-
123
-
124
-
125
-
126
-
127
-
128
-
129
-
130
-
131
-
132
-
133
-
134
-
135
-
136
-
137
-
138
-
139
-
140
-
141
-
142
-
143
-
144
-
145
-
146
-
147
-
148
-
149
-
150
-
151
-
152
-
153
-
154
-
155
-
156
-
157
-
158
-
159
-
160
-
161
-
162
-
163
-
164
-
165
-
166
-
167
-
168
-
169
-
170
-
171
-
172
-
173
-
174
-
175
-
176
-
177
-
178
-
179
-
180
-
181
-
182
-
183
-
184
-
185
-
186
-
187
-
188
-
189
-
190
-
191
-
192
-
193
-
194
-
195
-
196
-
197
-
198
-
199
-
200
-
201
-
202
-
203
-
204
-
205
-
206
-
207
-
208
-
209
-
210
-
211
-
212
-
213
-
214
-
215
-
216
-
217
-
218
-
219
-
220
-
221
-
222
-
223
-
224
-
225
-
226
-
227
-
228
-
229
-
230
-
231
-
232
-
233
-
234
-
235
-
236
-
237
-
238
-
239
-
240
-
241
-
242
-
243
-
244
-
245
-
246
-
247
-
248
-
249
-
250
-
251
-
252
-
253
-
254
-
255
-
256
-
257
-
258
-
259
-
260
-
261
-
262
-
263
-
264
-
265
-
266
-
267
-
268
-
269
-
270
-
271
-
272
-
273
-
274
-
275
-
276
-
277
-
278
-
279
-
280
-
281
-
282
-
283
-
284
-
285
-
286
-
287
-
288
-
289
-
290
-
291
-
292
-
293
-
294
-
295
-
296
-
297
-
298
-
299
-
300
-
301
-
302
-
303
-
304
-
305
-
306
-
307
-
308
-
309
-
310
-
311
-
312
-
313
-
314
-
315
-
316
-
317
-
318
-
319
-
320
-
321
-
322
-
323
-
324
-
325
-
 326
326 -
 327
327 -
 328
328 -
 329
329 -
 330
330 -
 331
331 -
 332
332 -
 333
333 -
 334
334 -
 335
335 -
 336
336 -
 337
337 -
 338
338 -
 339
339 -
 340
340 -
 341
341 -
 342
342 -
 343
343 -
 344
344 -
 345
345 -
 346
346 -
347
-
348
-
349
-
350
-
351
-
352
-
353
-
354
-
355
-
356
-
357
-
358
-
359
-
360
-
361
-
362
-
363
-
364
-
365
-
366
-
367
-
368
-
369
-
370
-
371
-
372
-
373
-
374
-
375
-
376
-
377
-
378
 |
 |

HSBC HOLDINGS PLC
Notes on the Financial Statements (continued)
334
2004 2003
US$m US$m
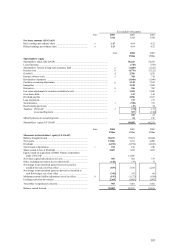
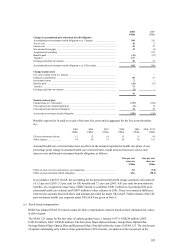
Change in projected benefit obligation
Projected benefit obligation as at 1 January ................................................................. 21,085 15,463
Service cost ................................................................................................................. 743 429
Interest cost ................................................................................................................. 1,209 915
Employee contributions ............................................................................................... 21 4
Net actuarial loss .......................................................................................................... 1,244 2,306
Acquisition of subsidiary ............................................................................................. –897
Plan amendment .......................................................................................................... –6
Benefits paid ................................................................................................................ (845) (714)
Transfers ......................................................................................................................417 –
Exchange movements .................................................................................................. 1,632 1,779
Projected benefit obligation as at 31 December ........................................................... 25,506 21,085
Change in plan assets
Plan assets at fair value as at 1 January ........................................................................ 17,344 11,786
Actual return on plan assets ......................................................................................... 1,828 2,399
Acquisition of subsidiary ............................................................................................. –832
Employer contributions ............................................................................................... 431 1,653
Employee contributions ............................................................................................... 21 4
Benefits paid ................................................................................................................ (845) (714)
Transfers ......................................................................................................................264 –
Exchange movements .................................................................................................. 1,235 1,384
Plan assets at fair value as at 31 December .................................................................. 20,278 17,344
Funded status ............................................................................................................... (5,228) (3,741)
Unrecognised net actuarial loss ................................................................................... 4,526 3,558
Unrecognised prior service cost ................................................................................... 49 42
Accrued pension cost ................................................................................................... (653) (141)
Additional minimum liability ...................................................................................... (3,261) (2,789)
Intangible assets .......................................................................................................... 12 14
Net amount recognised ................................................................................................. (3,902) (2,916)
Amounts recognised under US GAAP in the balance sheet consist of:
Prepaid benefit cost ..................................................................................................... 783 833
Accrued benefit liability .............................................................................................. (1,436) (974)
Additional minimum liability ...................................................................................... (3,261) (2,789)
Intangible assets .......................................................................................................... 12 14
(3,902) (2,916)
US GAAP adjustment
Amount recognised under US GAAP .......................................................................... (3,902) (2,916)
Amounts recognised for these schemes under UK GAAP ........................................... (874) (206)
(4,776) (3,122)
In 2004, plans with an aggregate accumulated benefit obligation of U$20,566 million
(2003: US$17,332 million) and assets with an aggregate fair value of US$16,128 million (2003: US$13,739
million) had an accumulated benefit obligation in excess of plan assets. Plans with an aggregate projected
benefit obligation of US$22,914 million (2003: US$17,841 million) and assets with an aggregate fair value
of US$17,422 million (2003: US$13,739 million) had a projected benefit obligation in excess of plan assets.
Plan assets are invested primarily in equities, fixed interest securities and property. Included within plan
assets at 31 December 2004 are direct holdings of 4,797,952 HSBC Holdings shares with a market value of
US$82 million (2003:760,690 shares; US$12 million). Plan asset valuations are as at 31 December.
The projected benefit obligations at 31 December 2004 and 2003 for HSBC’ s main pension plans have been
calculated using the following financial assumptions on a weighted average basis: