HSBC 2004 Annual Report Download - page 277
Download and view the complete annual report
Please find page 277 of the 2004 HSBC annual report below. You can navigate through the pages in the report by either clicking on the pages listed below, or by using the keyword search tool below to find specific information within the annual report.-
 1
1 -
2
-
3
-
4
-
5
-
6
-
7
-
8
-
9
-
10
-
11
-
12
-
13
-
14
-
15
-
16
-
17
-
18
-
19
-
20
-
21
-
22
-
23
-
24
-
25
-
26
-
27
-
28
-
29
-
30
-
31
-
32
-
33
-
34
-
35
-
36
-
37
-
38
-
39
-
40
-
41
-
42
-
43
-
44
-
45
-
46
-
47
-
48
-
49
-
50
-
51
-
52
-
53
-
54
-
55
-
56
-
57
-
58
-
59
-
60
-
61
-
62
-
63
-
64
-
65
-
66
-
67
-
68
-
69
-
70
-
71
-
72
-
73
-
74
-
75
-
76
-
77
-
78
-
79
-
80
-
81
-
82
-
83
-
84
-
85
-
86
-
87
-
88
-
89
-
90
-
91
-
92
-
93
-
94
-
95
-
96
-
97
-
98
-
99
-
100
-
101
-
102
-
103
-
104
-
105
-
106
-
107
-
108
-
109
-
110
-
111
-
112
-
113
-
114
-
115
-
116
-
117
-
118
-
119
-
120
-
121
-
122
-
123
-
124
-
125
-
126
-
127
-
128
-
129
-
130
-
131
-
132
-
133
-
134
-
135
-
136
-
137
-
138
-
139
-
140
-
141
-
142
-
143
-
144
-
145
-
146
-
147
-
148
-
149
-
150
-
151
-
152
-
153
-
154
-
155
-
156
-
157
-
158
-
159
-
160
-
161
-
162
-
163
-
164
-
165
-
166
-
167
-
168
-
169
-
170
-
171
-
172
-
173
-
174
-
175
-
176
-
177
-
178
-
179
-
180
-
181
-
182
-
183
-
184
-
185
-
186
-
187
-
188
-
189
-
190
-
191
-
192
-
193
-
194
-
195
-
196
-
197
-
198
-
199
-
200
-
201
-
202
-
203
-
204
-
205
-
206
-
207
-
208
-
209
-
210
-
211
-
212
-
213
-
214
-
215
-
216
-
217
-
218
-
219
-
220
-
221
-
222
-
223
-
224
-
225
-
226
-
227
-
228
-
229
-
230
-
231
-
232
-
233
-
234
-
235
-
236
-
237
-
238
-
239
-
240
-
241
-
242
-
243
-
244
-
245
-
246
-
247
-
248
-
249
-
250
-
251
-
252
-
253
-
254
-
255
-
256
-
257
-
258
-
259
-
260
-
261
-
262
-
263
-
264
-
265
-
266
-
 267
267 -
 268
268 -
 269
269 -
 270
270 -
 271
271 -
 272
272 -
 273
273 -
 274
274 -
 275
275 -
 276
276 -
 277
277 -
 278
278 -
 279
279 -
 280
280 -
 281
281 -
 282
282 -
 283
283 -
 284
284 -
 285
285 -
 286
286 -
 287
287 -
288
-
289
-
290
-
291
-
292
-
293
-
294
-
295
-
296
-
297
-
298
-
299
-
300
-
301
-
302
-
303
-
304
-
305
-
306
-
307
-
308
-
309
-
310
-
311
-
312
-
313
-
314
-
315
-
316
-
317
-
318
-
319
-
320
-
321
-
322
-
323
-
324
-
325
-
326
-
327
-
328
-
329
-
330
-
331
-
332
-
333
-
334
-
335
-
336
-
337
-
338
-
339
-
340
-
341
-
342
-
343
-
344
-
345
-
346
-
347
-
348
-
349
-
350
-
351
-
352
-
353
-
354
-
355
-
356
-
357
-
358
-
359
-
360
-
361
-
362
-
363
-
364
-
365
-
366
-
367
-
368
-
369
-
370
-
371
-
372
-
373
-
374
-
375
-
376
-
377
-
378
 |
 |

275
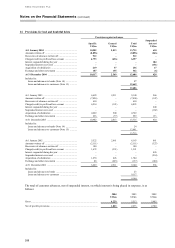
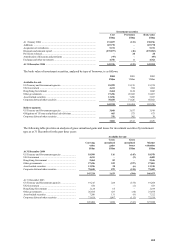
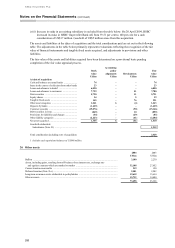
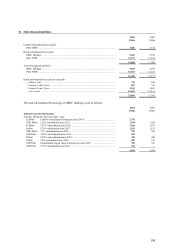
Goodwill
Intangible
assets Total
US$m US$m US$m
Cost at 1 January 2004 ................................................................................... 32,674 178 32,852
Additions and acquisitions of subsidiaries (note 25) ...................................... 1,223 111 1,334
Exchange and other movements ..................................................................... 1,535 16 1,551
Cost at 31 December 2004 ........................................................................... 35,432 305 35,737
Accumulated amortisation at 1 January 2004 ................................................. (4,196) (16) (4,212)
Charge to the profit and loss account ............................................................. (1,814) (28) (1,842)
Exchange and other movements ..................................................................... (300) (1) (301)
Accumulated amortisation at 31 December 2004 ...................................... (6,310) (45) (6,355)
Net book value at 31 December 2004 .......................................................... 29,122 260 29,382
Net book value at 31 December 2003 ............................................................ 28,478 162 28,640
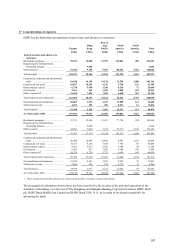
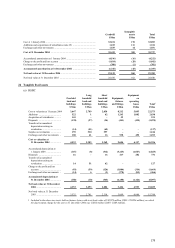
24 Tangible fixed assets
(a) HSBC
Freehold
land and
buildings
Long
leasehold
land and
buildings
Short
leasehold
land and
buildings
Equipment,
fixtures
and fittings
Equipment
on
operating
leases Total1
US$m US$m US$m US$m US$m US$m
Cost or valuation at 1 January 2004 3,647 2,789 2,830 8,212 5,095 22,573
Additions ..................................... 522 1 62 1,243 1,002 2,830
Acquisition of subsidiaries ........... 169 – – 52 – 221
Disposals ..................................... (138) (27) (34) (441) (430) (1,070)
Transfer of accumulated
depreciation arising on
revaluation ............................... (14) (51) (62) – – (127)
Surplus on revaluation ................. 159 530 557 – – 1,246
Exchange and other movements .. 18861165384501,253
Cost or valuation at
31 December 2004 .................. 4,533 3,303 3,369 9,604 6,117 26,926
Accumulated depreciation at
1 January 2004 ........................ (115) (8) (512) (5,143) (1,047) (6,825)
Disposals ..................................... 16 – 16 417 282 731
Transfer of accumulated
depreciation arising on
revaluation ............................... 14 51 62 – – 127
Charge to the profit and loss
account .................................... (81) (59) (126) (1,084) (314) (1,664)
Exchange and other movements .. (14) 6 (3) (370) (85) (466)
Accumulated depreciation at
31 December 2004 .................. (180) (10) (563) (6,180) (1,164) (8,097)
Net book value at 31 December
2004 ......................................... 4,353 3,293 2,806 3,424 4,953 18,829
Net book value at 31 December
2003 ......................................... 3,532 2,781 2,318 3,069 4,048 15,748
1Included in the above are assets held on finance leases with a net book value of US$370 million (2003: US$284 million), on which
the depreciation charge for the year to 31 December 2004 was US$10 million (2003: US$8 million).