HSBC 2004 Annual Report Download - page 225
Download and view the complete annual report
Please find page 225 of the 2004 HSBC annual report below. You can navigate through the pages in the report by either clicking on the pages listed below, or by using the keyword search tool below to find specific information within the annual report.-
 1
1 -
2
-
3
-
4
-
5
-
6
-
7
-
8
-
9
-
10
-
11
-
12
-
13
-
14
-
15
-
16
-
17
-
18
-
19
-
20
-
21
-
22
-
23
-
24
-
25
-
26
-
27
-
28
-
29
-
30
-
31
-
32
-
33
-
34
-
35
-
36
-
37
-
38
-
39
-
40
-
41
-
42
-
43
-
44
-
45
-
46
-
47
-
48
-
49
-
50
-
51
-
52
-
53
-
54
-
55
-
56
-
57
-
58
-
59
-
60
-
61
-
62
-
63
-
64
-
65
-
66
-
67
-
68
-
69
-
70
-
71
-
72
-
73
-
74
-
75
-
76
-
77
-
78
-
79
-
80
-
81
-
82
-
83
-
84
-
85
-
86
-
87
-
88
-
89
-
90
-
91
-
92
-
93
-
94
-
95
-
96
-
97
-
98
-
99
-
100
-
101
-
102
-
103
-
104
-
105
-
106
-
107
-
108
-
109
-
110
-
111
-
112
-
113
-
114
-
115
-
116
-
117
-
118
-
119
-
120
-
121
-
122
-
123
-
124
-
125
-
126
-
127
-
128
-
129
-
130
-
131
-
132
-
133
-
134
-
135
-
136
-
137
-
138
-
139
-
140
-
141
-
142
-
143
-
144
-
145
-
146
-
147
-
148
-
149
-
150
-
151
-
152
-
153
-
154
-
155
-
156
-
157
-
158
-
159
-
160
-
161
-
162
-
163
-
164
-
165
-
166
-
167
-
168
-
169
-
170
-
171
-
172
-
173
-
174
-
175
-
176
-
177
-
178
-
179
-
180
-
181
-
182
-
183
-
184
-
185
-
186
-
187
-
188
-
189
-
190
-
191
-
192
-
193
-
194
-
195
-
196
-
197
-
198
-
199
-
200
-
201
-
202
-
203
-
204
-
205
-
206
-
207
-
208
-
209
-
210
-
211
-
212
-
213
-
214
-
 215
215 -
 216
216 -
 217
217 -
 218
218 -
 219
219 -
 220
220 -
 221
221 -
 222
222 -
 223
223 -
 224
224 -
 225
225 -
 226
226 -
 227
227 -
 228
228 -
 229
229 -
 230
230 -
 231
231 -
 232
232 -
 233
233 -
 234
234 -
 235
235 -
236
-
237
-
238
-
239
-
240
-
241
-
242
-
243
-
244
-
245
-
246
-
247
-
248
-
249
-
250
-
251
-
252
-
253
-
254
-
255
-
256
-
257
-
258
-
259
-
260
-
261
-
262
-
263
-
264
-
265
-
266
-
267
-
268
-
269
-
270
-
271
-
272
-
273
-
274
-
275
-
276
-
277
-
278
-
279
-
280
-
281
-
282
-
283
-
284
-
285
-
286
-
287
-
288
-
289
-
290
-
291
-
292
-
293
-
294
-
295
-
296
-
297
-
298
-
299
-
300
-
301
-
302
-
303
-
304
-
305
-
306
-
307
-
308
-
309
-
310
-
311
-
312
-
313
-
314
-
315
-
316
-
317
-
318
-
319
-
320
-
321
-
322
-
323
-
324
-
325
-
326
-
327
-
328
-
329
-
330
-
331
-
332
-
333
-
334
-
335
-
336
-
337
-
338
-
339
-
340
-
341
-
342
-
343
-
344
-
345
-
346
-
347
-
348
-
349
-
350
-
351
-
352
-
353
-
354
-
355
-
356
-
357
-
358
-
359
-
360
-
361
-
362
-
363
-
364
-
365
-
366
-
367
-
368
-
369
-
370
-
371
-
372
-
373
-
374
-
375
-
376
-
377
-
378
 |
 |

223
Graph 2: HSBC TSR and FTSE 100 Index
50%
60%
70%
80%
90%
100%
110%
120%
130%
140%
150%
Mar 2001 Mar 2002 Mar 2003 Mar 2004
HSBC TSR FTSE 100
Graph 3: HSBC TSR and MSCI World Index
50%
60%
70%
80%
90%
100%
110%
120%
130%
140%
150%
Mar 2001 Mar 2002 Mar 2003 Mar 2004
HSBC TSR MSCI World Index
Graph 1: HSBC TSR and Benchmark TSR
70%
80%
90%
100%
110%
120%
130%
140%
Mar 2001 Mar 2002 Mar 2003 Mar 2004
HSBC TSR TSR Benchmark
Graph 4: HSBC TSR and MSCI Financials Index
60%
70%
80%
90%
100%
110%
120%
130%
140%
Mar 2001 Mar 2002 Mar 2003 Mar 2004
HSBC TSR MSCI Financials
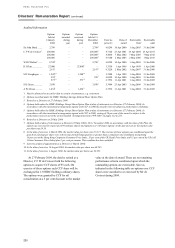
The Performance Shares awarded in 2000
passed their three-year TSR performance condition
in March 2003 and will vest on the fifth anniversary
of the award, 10 March 2005.
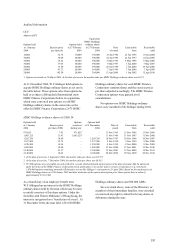
Total Shareholder Return
The graphs below show HSBC Holdings’ TSR
performance against the benchmark TSR (graph 1),
the Financial Times-Stock Exchange (‘FTSE’ ) 100
Index (graph 2), the Morgan Stanley Capital
International (‘MSCI’ ) World Index (graph 3) and
MSCI Financials Index (graph 4) over the three-year
period to March 2004. These measures have been
chosen as they are the main published indices against
which HSBC monitors its performance. Pursuant to the Directors’ Remuneration Report
Regulations 2002, graph 5 below shows HSBC
Holdings’ TSR performance against a broad equity
market index, the Financial Times-Stock Exchange
(‘FTSE’ ) 100 Index, for the five-year period ended
31 December 2004.
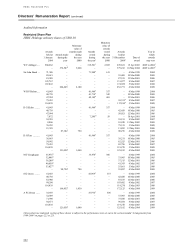
Pensions
The pension entitlements earned by the executive
Directors during the year are set out on pages 228
and 229.
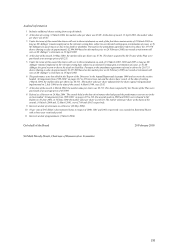
Service contracts and terms of appointment
HSBC’ s policy is to employ executive Directors on
one-year rolling contracts although, on recruitment,
longer initial terms may be approved by the
Remuneration Committee. The Remuneration
Committee will, consistent with the best interests of
the Group, seek to minimise termination payments.
No executive Director has a service contract
with HSBC Holdings or any of its subsidiaries with a
notice period in excess of one year or with
provisions for predetermined compensation on
termination which exceeds one year’s salary and
benefits in kind, save as referred to below. There are
Graph 5: HSBC TSR and FTSE 100 Index
50%
60%
70%
80%
90%
10 0 %
110 %
12 0 %
13 0 %
14 0 %
15 0 %
Dec 1999 Dec 2000 Dec 2001 Dec 2002 Dec 2003 Dec 2004
HSBC TSR FTSE 100
Source: Datastream