HSBC 2004 Annual Report Download - page 83
Download and view the complete annual report
Please find page 83 of the 2004 HSBC annual report below. You can navigate through the pages in the report by either clicking on the pages listed below, or by using the keyword search tool below to find specific information within the annual report.-
 1
1 -
2
-
3
-
4
-
5
-
6
-
7
-
8
-
9
-
10
-
11
-
12
-
13
-
14
-
15
-
16
-
17
-
18
-
19
-
20
-
21
-
22
-
23
-
24
-
25
-
26
-
27
-
28
-
29
-
30
-
31
-
32
-
33
-
34
-
35
-
36
-
37
-
38
-
39
-
40
-
41
-
42
-
43
-
44
-
45
-
46
-
47
-
48
-
49
-
50
-
51
-
52
-
53
-
54
-
55
-
56
-
57
-
58
-
59
-
60
-
61
-
62
-
63
-
64
-
65
-
66
-
67
-
68
-
69
-
70
-
71
-
72
-
 73
73 -
 74
74 -
 75
75 -
 76
76 -
 77
77 -
 78
78 -
 79
79 -
 80
80 -
 81
81 -
 82
82 -
 83
83 -
 84
84 -
 85
85 -
 86
86 -
 87
87 -
 88
88 -
 89
89 -
 90
90 -
 91
91 -
 92
92 -
 93
93 -
94
-
95
-
96
-
97
-
98
-
99
-
100
-
101
-
102
-
103
-
104
-
105
-
106
-
107
-
108
-
109
-
110
-
111
-
112
-
113
-
114
-
115
-
116
-
117
-
118
-
119
-
120
-
121
-
122
-
123
-
124
-
125
-
126
-
127
-
128
-
129
-
130
-
131
-
132
-
133
-
134
-
135
-
136
-
137
-
138
-
139
-
140
-
141
-
142
-
143
-
144
-
145
-
146
-
147
-
148
-
149
-
150
-
151
-
152
-
153
-
154
-
155
-
156
-
157
-
158
-
159
-
160
-
161
-
162
-
163
-
164
-
165
-
166
-
167
-
168
-
169
-
170
-
171
-
172
-
173
-
174
-
175
-
176
-
177
-
178
-
179
-
180
-
181
-
182
-
183
-
184
-
185
-
186
-
187
-
188
-
189
-
190
-
191
-
192
-
193
-
194
-
195
-
196
-
197
-
198
-
199
-
200
-
201
-
202
-
203
-
204
-
205
-
206
-
207
-
208
-
209
-
210
-
211
-
212
-
213
-
214
-
215
-
216
-
217
-
218
-
219
-
220
-
221
-
222
-
223
-
224
-
225
-
226
-
227
-
228
-
229
-
230
-
231
-
232
-
233
-
234
-
235
-
236
-
237
-
238
-
239
-
240
-
241
-
242
-
243
-
244
-
245
-
246
-
247
-
248
-
249
-
250
-
251
-
252
-
253
-
254
-
255
-
256
-
257
-
258
-
259
-
260
-
261
-
262
-
263
-
264
-
265
-
266
-
267
-
268
-
269
-
270
-
271
-
272
-
273
-
274
-
275
-
276
-
277
-
278
-
279
-
280
-
281
-
282
-
283
-
284
-
285
-
286
-
287
-
288
-
289
-
290
-
291
-
292
-
293
-
294
-
295
-
296
-
297
-
298
-
299
-
300
-
301
-
302
-
303
-
304
-
305
-
306
-
307
-
308
-
309
-
310
-
311
-
312
-
313
-
314
-
315
-
316
-
317
-
318
-
319
-
320
-
321
-
322
-
323
-
324
-
325
-
326
-
327
-
328
-
329
-
330
-
331
-
332
-
333
-
334
-
335
-
336
-
337
-
338
-
339
-
340
-
341
-
342
-
343
-
344
-
345
-
346
-
347
-
348
-
349
-
350
-
351
-
352
-
353
-
354
-
355
-
356
-
357
-
358
-
359
-
360
-
361
-
362
-
363
-
364
-
365
-
366
-
367
-
368
-
369
-
370
-
371
-
372
-
373
-
374
-
375
-
376
-
377
-
378
 |
 |

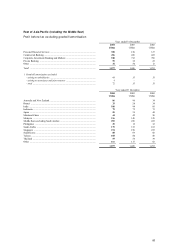
81
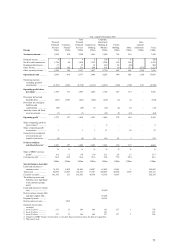
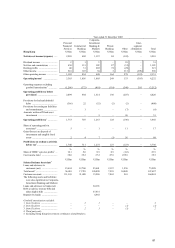
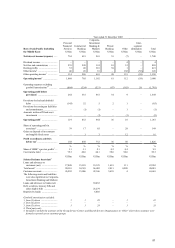
Year ended 31 December 2003
Hong Kong
Personal
Financial
Services
US$m
Commercial
Banking
US$m
Corporate,
Investment
Banking &
Markets
US$m
Private
Banking
US$m
Other
US$m
Inter-
segment
elimination
US$m
Total
US$m
Net interest income/(expense) ...... 2,203 602 1,157 84 (145) – 3,901
Dividend income ............................ 2 1 3 – 25 – 31
Net fees and commissions .............. 630 315 382 87 (31) – 1,383
Dealing profits ............................... 40 31 205 74 (29) – 321
Other income ................................. 510 107 58 3 313 (395) 596
Other operating income .................. 1,182 454 648 164 278 (395) 2,331
Operating income1 ....................... 3,385 1,056 1,805 248 133 (395) 6,232
Operating expenses excluding
goodwill amortisation1 ............... (1,286) (372) (491) (118) (340) 395 (2,212)
Operating profit/(loss) before
provisions1 ................................. 2,099 684 1,314 130 (207) – 4,020
Provisions for bad and doubtful
debts .......................................... (366) 22 (52) (2) (2) – (400)
Provisions for contingent liabilities
and commitments ....................... – 1 – – (7) – (6)
Amounts written off fixed asset
investments ................................ ––5–26–31
Operating profit/(loss)1 ................ 1,733 707 1,267 128 (190) – 3,645
Share of operating profit in
associates2 .................................. 5–1–11–17
Gains/(losses) on disposal of
investments and tangible fixed
assets .......................................... 2 4 7 (1) 56 – 68
Profit/(loss) on ordinary activities
before tax3.................................. 1,740 711 1,275 127 (123) – 3,730
%%%%% %
Share of HSBC’ s pre-tax profits3 ... 12.1 5.0 8.9 0.9 (1.0) 25.9
Cost:income ratio1 .......................... 38.0 35.2 27.2 47.6 255.6 35.5
US$m US$m US$m US$m US$m US$m
Selected balance sheet data4
Loans and advances to
customers (net) .......................... 33,494 12,760 23,441 2,357 1,936 73,988
Total assets5 .................................... 36,410 17,783 120,890 7,555 14,849 197,487
Customer accounts ......................... 111,145 31,490 13,286 7,862 241 164,024
The following assets and liabilities
were also significant to Corporate,
Investment Banking and Markets:
Loans and advances to banks (net) . 34,165
Debt securities, treasury bills and
other eligible bills ...................... 57,831
Deposits by banks .......................... 4,665
Goodwill amortisation excluded:
1from (1) above ........................... – 21–– 3
2from (2) above ........................... – – – – (1) (1)
3from (3) above ........................... – 21–(1) 2
4Third party only.
5Excluding Hong Kong Government certificates of indebtedness.