HSBC 2004 Annual Report Download - page 76
Download and view the complete annual report
Please find page 76 of the 2004 HSBC annual report below. You can navigate through the pages in the report by either clicking on the pages listed below, or by using the keyword search tool below to find specific information within the annual report.-
 1
1 -
2
-
3
-
4
-
5
-
6
-
7
-
8
-
9
-
10
-
11
-
12
-
13
-
14
-
15
-
16
-
17
-
18
-
19
-
20
-
21
-
22
-
23
-
24
-
25
-
26
-
27
-
28
-
29
-
30
-
31
-
32
-
33
-
34
-
35
-
36
-
37
-
38
-
39
-
40
-
41
-
42
-
43
-
44
-
45
-
46
-
47
-
48
-
49
-
50
-
51
-
52
-
53
-
54
-
55
-
56
-
57
-
58
-
59
-
60
-
61
-
62
-
63
-
64
-
65
-
 66
66 -
 67
67 -
 68
68 -
 69
69 -
 70
70 -
 71
71 -
 72
72 -
 73
73 -
 74
74 -
 75
75 -
 76
76 -
 77
77 -
 78
78 -
 79
79 -
 80
80 -
 81
81 -
 82
82 -
 83
83 -
 84
84 -
 85
85 -
 86
86 -
87
-
88
-
89
-
90
-
91
-
92
-
93
-
94
-
95
-
96
-
97
-
98
-
99
-
100
-
101
-
102
-
103
-
104
-
105
-
106
-
107
-
108
-
109
-
110
-
111
-
112
-
113
-
114
-
115
-
116
-
117
-
118
-
119
-
120
-
121
-
122
-
123
-
124
-
125
-
126
-
127
-
128
-
129
-
130
-
131
-
132
-
133
-
134
-
135
-
136
-
137
-
138
-
139
-
140
-
141
-
142
-
143
-
144
-
145
-
146
-
147
-
148
-
149
-
150
-
151
-
152
-
153
-
154
-
155
-
156
-
157
-
158
-
159
-
160
-
161
-
162
-
163
-
164
-
165
-
166
-
167
-
168
-
169
-
170
-
171
-
172
-
173
-
174
-
175
-
176
-
177
-
178
-
179
-
180
-
181
-
182
-
183
-
184
-
185
-
186
-
187
-
188
-
189
-
190
-
191
-
192
-
193
-
194
-
195
-
196
-
197
-
198
-
199
-
200
-
201
-
202
-
203
-
204
-
205
-
206
-
207
-
208
-
209
-
210
-
211
-
212
-
213
-
214
-
215
-
216
-
217
-
218
-
219
-
220
-
221
-
222
-
223
-
224
-
225
-
226
-
227
-
228
-
229
-
230
-
231
-
232
-
233
-
234
-
235
-
236
-
237
-
238
-
239
-
240
-
241
-
242
-
243
-
244
-
245
-
246
-
247
-
248
-
249
-
250
-
251
-
252
-
253
-
254
-
255
-
256
-
257
-
258
-
259
-
260
-
261
-
262
-
263
-
264
-
265
-
266
-
267
-
268
-
269
-
270
-
271
-
272
-
273
-
274
-
275
-
276
-
277
-
278
-
279
-
280
-
281
-
282
-
283
-
284
-
285
-
286
-
287
-
288
-
289
-
290
-
291
-
292
-
293
-
294
-
295
-
296
-
297
-
298
-
299
-
300
-
301
-
302
-
303
-
304
-
305
-
306
-
307
-
308
-
309
-
310
-
311
-
312
-
313
-
314
-
315
-
316
-
317
-
318
-
319
-
320
-
321
-
322
-
323
-
324
-
325
-
326
-
327
-
328
-
329
-
330
-
331
-
332
-
333
-
334
-
335
-
336
-
337
-
338
-
339
-
340
-
341
-
342
-
343
-
344
-
345
-
346
-
347
-
348
-
349
-
350
-
351
-
352
-
353
-
354
-
355
-
356
-
357
-
358
-
359
-
360
-
361
-
362
-
363
-
364
-
365
-
366
-
367
-
368
-
369
-
370
-
371
-
372
-
373
-
374
-
375
-
376
-
377
-
378
 |
 |

HSBC HOLDINGS PLC
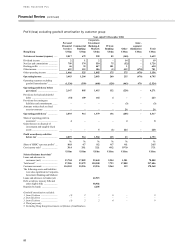
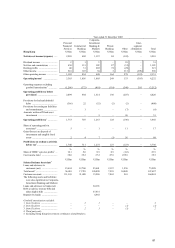
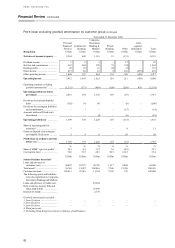
Financial Review (continued)
74
Year ended 31 December
2004
US$m
2003
US$m
2002
US$m
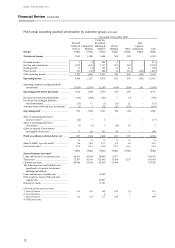
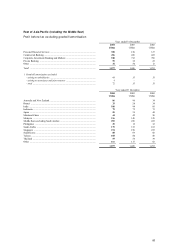
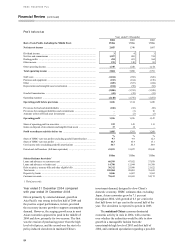
Selected balance sheet data1
Loans and advances to customers (net) .......................................................... 78,888 73,988 69,948
Loans and advances to banks (net) ................................................................. 45,300 38,640 33,359
Debt securities, treasury bills and other eligible bills ..................................... 69,464 66,158 60,083
Total assets2 ................................................................................................... 217,406 197,487 180,433
Deposits by banks .......................................................................................... 4,325 4,777 2,379
Customer accounts ......................................................................................... 178,368 164,024 148,904
1Third party only.
2Excluding Hong Kong Government certificates of indebtedness.
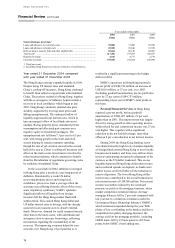
Year ended 31 December 2004 compared
with year ended 31 December 2003
The Hong Kong economy expanded rapidly in 2004.
Despite rising US interest rates and mainland
China’ s cooling-off measures, Hong Kong continued
to benefit from robust re-export trade with mainland
China. The positive outlook for Hong Kong, together
with the re-emergence of inflation, helped sustain a
recovery in local confidence which began in late
2003. Hong Kong’ s domestic demand also grew
steadily, supported by reviving asset prices and
falling unemployment. The continued inflow of
liquidity suppressed local interest rates, which in
turn encouraged a flow of local funds into asset
markets. Rising property prices stimulated private
consumption and alleviated past concerns over
negative equity in residential mortgages. The
unemployment rate fell from 7.3 per cent to 6.5 per
cent, with strong growth in the trade and retail
sectors helping to sustain consumer spending,
though the rate of job creation slowed in the second
half of the year as China’ s cooling-off measures took
effect on the trade sector. Investment revived in the
robust tourism industry, which continued to benefit
from the liberalisation of regulations governing visits
by residents of mainland China.
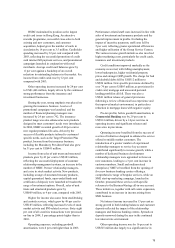
In the second half of 2004, inflation re-emerged
in Hong Kong after a nearly six year-long period of
deflation. Stimulated by a weak US dollar,
recovering property prices and rising local
confidence, prices rose from a year ago when the
economy was suffering from the effect of the severe
acute respiratory syndrome (‘SARS’ ) epidemic.
Significant inflows of liquidity from foreign
investors left the Hong Kong market flush with
surplus funds. This caused Hong Kong dollar and
US dollar interest rates to diverge, with the already
cash-rich local economy slow to absorb external
funds. Moreover, demand for credit remained muted,
other than in the trade sector, with individuals and
enterprises slow to increase borrowings, reflecting
nervousness regarding the sustainability of the
recovery. The improving economy helped to ease
concerns over Hong Kong’ s fiscal position as it
resulted in a significant narrowing in the budget
deficit in 2004.
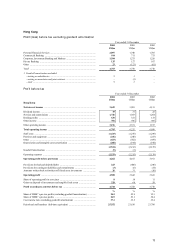
HSBC’s operations in Hong Kong reported a
pre-tax profit of US$4,744 million, an increase of
US$1,016 million, or 27 per cent, over 2003.
Excluding goodwill amortisation, pre-tax profit also
grew by 27 per cent to US$4,753 million,
representing 24 per cent of HSBC’s total profit on
this basis.
Personal Financial Services in Hong Kong
reported a pre-tax profit, before goodwill
amortisation, of US$2,097 million, 21 per cent
higher than in 2003. This improvement was largely
driven by strong growth in other operating income,
within which fee and commission income was 27 per
cent higher. This, together with a significant
reduction in the net bad debt charge, more than
offset an 8 per cent reduction in net interest income.
During 2004, the Hong Kong banking sector
was characterised by high levels of surplus liquidity
as foreign funds entered Hong Kong to invest in the
buoyant stock market, and there were inflows from
investors anticipating an upward realignment of the
currency as the US dollar weakened. This excess
liquidity depressed Hong Kong dollar interest rates
and so reduced spreads on deposits, as banks were
unable to pass on the full effect of the reduction in
rates to depositors. The lower Hong Kong dollar
interest rates contributed to the overall reduction in
net interest income of US$186 million. Net interest
income was further reduced by the continued
pressure on yields in the mortgage business, where
market competition remained intense. Average
mortgage balances fell by 2 per cent compared with
last year due to a reduction in balances under the
Government Home Ownership Scheme (‘GHOS’ ),
which remained suspended during the year. With
plenty of low cost funding in the market, and fierce
competition for quality mortgage business, the
average yield on the mortgage portfolio, excluding
GHOS loans, fell by 25 basis points to 202 basis
points below HSBC’s best lending rate.