HSBC 2004 Annual Report Download - page 75
Download and view the complete annual report
Please find page 75 of the 2004 HSBC annual report below. You can navigate through the pages in the report by either clicking on the pages listed below, or by using the keyword search tool below to find specific information within the annual report.-
 1
1 -
2
-
3
-
4
-
5
-
6
-
7
-
8
-
9
-
10
-
11
-
12
-
13
-
14
-
15
-
16
-
17
-
18
-
19
-
20
-
21
-
22
-
23
-
24
-
25
-
26
-
27
-
28
-
29
-
30
-
31
-
32
-
33
-
34
-
35
-
36
-
37
-
38
-
39
-
40
-
41
-
42
-
43
-
44
-
45
-
46
-
47
-
48
-
49
-
50
-
51
-
52
-
53
-
54
-
55
-
56
-
57
-
58
-
59
-
60
-
61
-
62
-
63
-
64
-
 65
65 -
 66
66 -
 67
67 -
 68
68 -
 69
69 -
 70
70 -
 71
71 -
 72
72 -
 73
73 -
 74
74 -
 75
75 -
 76
76 -
 77
77 -
 78
78 -
 79
79 -
 80
80 -
 81
81 -
 82
82 -
 83
83 -
 84
84 -
 85
85 -
86
-
87
-
88
-
89
-
90
-
91
-
92
-
93
-
94
-
95
-
96
-
97
-
98
-
99
-
100
-
101
-
102
-
103
-
104
-
105
-
106
-
107
-
108
-
109
-
110
-
111
-
112
-
113
-
114
-
115
-
116
-
117
-
118
-
119
-
120
-
121
-
122
-
123
-
124
-
125
-
126
-
127
-
128
-
129
-
130
-
131
-
132
-
133
-
134
-
135
-
136
-
137
-
138
-
139
-
140
-
141
-
142
-
143
-
144
-
145
-
146
-
147
-
148
-
149
-
150
-
151
-
152
-
153
-
154
-
155
-
156
-
157
-
158
-
159
-
160
-
161
-
162
-
163
-
164
-
165
-
166
-
167
-
168
-
169
-
170
-
171
-
172
-
173
-
174
-
175
-
176
-
177
-
178
-
179
-
180
-
181
-
182
-
183
-
184
-
185
-
186
-
187
-
188
-
189
-
190
-
191
-
192
-
193
-
194
-
195
-
196
-
197
-
198
-
199
-
200
-
201
-
202
-
203
-
204
-
205
-
206
-
207
-
208
-
209
-
210
-
211
-
212
-
213
-
214
-
215
-
216
-
217
-
218
-
219
-
220
-
221
-
222
-
223
-
224
-
225
-
226
-
227
-
228
-
229
-
230
-
231
-
232
-
233
-
234
-
235
-
236
-
237
-
238
-
239
-
240
-
241
-
242
-
243
-
244
-
245
-
246
-
247
-
248
-
249
-
250
-
251
-
252
-
253
-
254
-
255
-
256
-
257
-
258
-
259
-
260
-
261
-
262
-
263
-
264
-
265
-
266
-
267
-
268
-
269
-
270
-
271
-
272
-
273
-
274
-
275
-
276
-
277
-
278
-
279
-
280
-
281
-
282
-
283
-
284
-
285
-
286
-
287
-
288
-
289
-
290
-
291
-
292
-
293
-
294
-
295
-
296
-
297
-
298
-
299
-
300
-
301
-
302
-
303
-
304
-
305
-
306
-
307
-
308
-
309
-
310
-
311
-
312
-
313
-
314
-
315
-
316
-
317
-
318
-
319
-
320
-
321
-
322
-
323
-
324
-
325
-
326
-
327
-
328
-
329
-
330
-
331
-
332
-
333
-
334
-
335
-
336
-
337
-
338
-
339
-
340
-
341
-
342
-
343
-
344
-
345
-
346
-
347
-
348
-
349
-
350
-
351
-
352
-
353
-
354
-
355
-
356
-
357
-
358
-
359
-
360
-
361
-
362
-
363
-
364
-
365
-
366
-
367
-
368
-
369
-
370
-
371
-
372
-
373
-
374
-
375
-
376
-
377
-
378
 |
 |

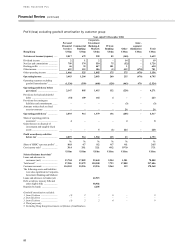
73
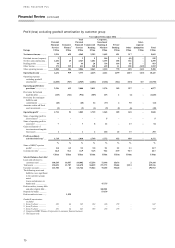
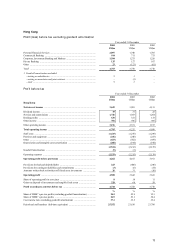
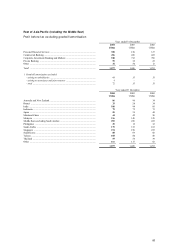
Hong Kong
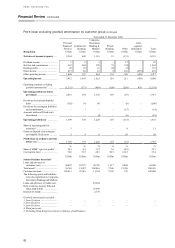
Profit/(loss) before tax excluding goodwill amortisation
Year ended 31 December
2004
US$m
2003
US$m
2002
US$m
Personal Financial Services ............................................................................ 2,097 1,740 1,705
Commercial Banking ..................................................................................... 914 711 733
Corporate, Investment Banking and Markets ................................................. 1,584 1,275 1,226
Private Banking ............................................................................................. 135 127 107
Other .............................................................................................................. 23 (123) (61)
Total1 ............................................................................................................. 4,753 3,730 3,710
1Goodwill amortisation excluded:
– arising on subsidiaries ............................................................................ 93–
– arising on associates and joint ventures ................................................. –(1)–
– total ......................................................................................................... 92–
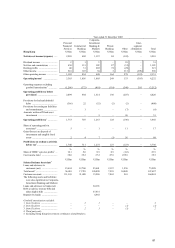
Profit before tax
Year ended 31 December
2004
US$m
2003
US$m
2002
US$m
Hong Kong
Net interest income ...................................................................................... 3,639 3,901 4,133
Dividend income ............................................................................................ 19 31 25
Net fees and commissions .............................................................................. 1,726 1,383 1,264
Dealing profits ............................................................................................... 630 321 133
Other income ................................................................................................. 781 596 495
Other operating income .................................................................................. 3,156 2,331 1,917
Total operating income ................................................................................ 6,795 6,232 6,050
Staff costs ...................................................................................................... (1,415) (1,276) (1,249)
Premises and equipment ................................................................................. (256) (240) (233)
Other .............................................................................................................. (653) (502) (459)
Depreciation and intangible asset amortisation .............................................. (200) (194) (198)
(2,524) (2,212) (2,139)
Goodwill amortisation ................................................................................... (9) (3) –
Operating expenses ........................................................................................ (2,533) (2,215) (2,139)
Operating profit before provisions ............................................................. 4,262 4,017 3,911
Provisions for bad and doubtful debts ............................................................ 223 (400) (246)
Provisions for contingent liabilities and commitments ................................... (3) (6) (14)
Amounts written back on/(written off) fixed asset investments ..................... 26 31 (10)
Operating profit ........................................................................................... 4,508 3,642 3,641
Share of operating profit in associates ............................................................ 818 11
Gains on disposal of investments and tangible fixed assets ............................ 228 68 58
Profit on ordinary activities before tax ...................................................... 4,744 3,728 3,710
%%%
Share of HSBC’ s pre-tax profits (excluding goodwill amortisation) .............. 24.5 25.9 35.3
Share of HSBC’ s pre-tax profits .................................................................... 26.9 29.1 38.4
Cost:income ratio (excluding goodwill amortisation) .................................... 37.1 35.5 35.4
Period-end staff numbers (full-time equivalent) ............................................. 25,552 23,636 23,786