HSBC 2004 Annual Report Download - page 111
Download and view the complete annual report
Please find page 111 of the 2004 HSBC annual report below. You can navigate through the pages in the report by either clicking on the pages listed below, or by using the keyword search tool below to find specific information within the annual report.-
 1
1 -
2
-
3
-
4
-
5
-
6
-
7
-
8
-
9
-
10
-
11
-
12
-
13
-
14
-
15
-
16
-
17
-
18
-
19
-
20
-
21
-
22
-
23
-
24
-
25
-
26
-
27
-
28
-
29
-
30
-
31
-
32
-
33
-
34
-
35
-
36
-
37
-
38
-
39
-
40
-
41
-
42
-
43
-
44
-
45
-
46
-
47
-
48
-
49
-
50
-
51
-
52
-
53
-
54
-
55
-
56
-
57
-
58
-
59
-
60
-
61
-
62
-
63
-
64
-
65
-
66
-
67
-
68
-
69
-
70
-
71
-
72
-
73
-
74
-
75
-
76
-
77
-
78
-
79
-
80
-
81
-
82
-
83
-
84
-
85
-
86
-
87
-
88
-
89
-
90
-
91
-
92
-
93
-
94
-
95
-
96
-
97
-
98
-
99
-
100
-
 101
101 -
 102
102 -
 103
103 -
 104
104 -
 105
105 -
 106
106 -
 107
107 -
 108
108 -
 109
109 -
 110
110 -
 111
111 -
 112
112 -
 113
113 -
 114
114 -
 115
115 -
 116
116 -
 117
117 -
 118
118 -
 119
119 -
 120
120 -
 121
121 -
122
-
123
-
124
-
125
-
126
-
127
-
128
-
129
-
130
-
131
-
132
-
133
-
134
-
135
-
136
-
137
-
138
-
139
-
140
-
141
-
142
-
143
-
144
-
145
-
146
-
147
-
148
-
149
-
150
-
151
-
152
-
153
-
154
-
155
-
156
-
157
-
158
-
159
-
160
-
161
-
162
-
163
-
164
-
165
-
166
-
167
-
168
-
169
-
170
-
171
-
172
-
173
-
174
-
175
-
176
-
177
-
178
-
179
-
180
-
181
-
182
-
183
-
184
-
185
-
186
-
187
-
188
-
189
-
190
-
191
-
192
-
193
-
194
-
195
-
196
-
197
-
198
-
199
-
200
-
201
-
202
-
203
-
204
-
205
-
206
-
207
-
208
-
209
-
210
-
211
-
212
-
213
-
214
-
215
-
216
-
217
-
218
-
219
-
220
-
221
-
222
-
223
-
224
-
225
-
226
-
227
-
228
-
229
-
230
-
231
-
232
-
233
-
234
-
235
-
236
-
237
-
238
-
239
-
240
-
241
-
242
-
243
-
244
-
245
-
246
-
247
-
248
-
249
-
250
-
251
-
252
-
253
-
254
-
255
-
256
-
257
-
258
-
259
-
260
-
261
-
262
-
263
-
264
-
265
-
266
-
267
-
268
-
269
-
270
-
271
-
272
-
273
-
274
-
275
-
276
-
277
-
278
-
279
-
280
-
281
-
282
-
283
-
284
-
285
-
286
-
287
-
288
-
289
-
290
-
291
-
292
-
293
-
294
-
295
-
296
-
297
-
298
-
299
-
300
-
301
-
302
-
303
-
304
-
305
-
306
-
307
-
308
-
309
-
310
-
311
-
312
-
313
-
314
-
315
-
316
-
317
-
318
-
319
-
320
-
321
-
322
-
323
-
324
-
325
-
326
-
327
-
328
-
329
-
330
-
331
-
332
-
333
-
334
-
335
-
336
-
337
-
338
-
339
-
340
-
341
-
342
-
343
-
344
-
345
-
346
-
347
-
348
-
349
-
350
-
351
-
352
-
353
-
354
-
355
-
356
-
357
-
358
-
359
-
360
-
361
-
362
-
363
-
364
-
365
-
366
-
367
-
368
-
369
-
370
-
371
-
372
-
373
-
374
-
375
-
376
-
377
-
378
 |
 |

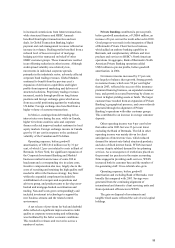
109
Profit/(loss) before tax
Year ended 31 December
2004 2003 2002
South America US$m US$m US$m
Net interest income ...................................................................................... 1,355 640 645
Dividend income ............................................................................................ 2315
Net fees and commissions .............................................................................. 480 338 324
Dealing profits ............................................................................................... 50 136 147
Other income ................................................................................................. 207 201 110
Other operating income .................................................................................. 739 678 596
Total operating income ................................................................................ 2,094 1,318 1,241
Staff costs ...................................................................................................... (660) (584) (572)
Premises and equipment ................................................................................. (174) (124) (113)
Other .............................................................................................................. (549) (327) (330)
Depreciation and intangible asset amortisation .............................................. (61) (40) (45)
(1,444) (1,075) (1,060)
Goodwill amortisation ................................................................................... (29) (11) (24)
Operating expenses ........................................................................................ (1,473) (1,086) (1,084)
Operating profit before provisions ............................................................. 621 232 157
Provisions for bad and doubtful debts ............................................................ (269) (58) (117)
Provisions for contingent liabilities and commitments ................................... 30 2 (31)
Loss from foreign currency redenomination in Argentina .............................. –(9) (68)
Amounts written off fixed asset investments ................................................. (6) (62) (36)
Operating profit/(loss) ................................................................................. 376 105 (95)
Share of operating profit in associated undertakings ...................................... 11–
Gains on disposal of investments and tangible fixed assets ............................ 38 937
Profit/(loss) on ordinary activities before tax ............................................. 415 115 (58)
%%%
Share of HSBC’ s pre-tax profits (excluding goodwill amortisation) .............. 2.3 0.9 (0.3)
Share of HSBC’ s pre-tax profits .................................................................... 2.4 0.9 (0.6)
Cost:income ratio (excluding goodwill amortisation) .................................... 69.0 81.6 85.4
Period-end staff numbers (full-time equivalent) ............................................. 32,108 28,292 25,522
US$m US$m US$m
Selected balance sheet data1
Loans and advances to customers (net) .......................................................... 6,933 4,982 3,028
Loans and advances to banks (net) ................................................................. 2,597 1,922 1,665
Debt securities, treasury bills and other eligible bills ..................................... 3,742 2,151 1,450
Total assets .................................................................................................... 17,397 12,549 8,491
Deposits by banks .......................................................................................... 680 828 661
Customer accounts ......................................................................................... 10,957 6,945 4,863
1 Third party only.
Year ended 31 December 2004 compared
with year ended 31 December 2003
Reaping the rewards of measures taken in 2003 and
helped by a buoyant external environment, Brazil
enjoyed an outstanding economic performance in
2004. Annualised GDP growth topped 4 per cent in
each of the first three quarters of 2004 and, for the
year as a whole, HSBC expects growth to exceed 5
per cent, driven by external demand. The 2004 trade
surplus reached US$34 billion and the current
account surplus US$12 billion. Employment and real
wages both expanded in 2004. Faster than
anticipated growth and some unexpected
consequences of tax changes pushed fiscal revenues
to record highs allowing the public sector to produce
a consolidated primary surplus in excess of 4 per