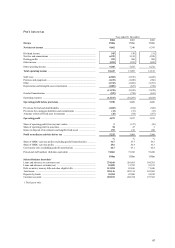
HSBC 2004 Annual Report Download - page 67
Download and view the complete annual report
Please find page 67 of the 2004 HSBC annual report below. You can navigate through the pages in the report by either clicking on the pages listed below, or by using the keyword search tool below to find specific information within the annual report.-
 1
1 -
2
-
3
-
4
-
5
-
6
-
7
-
8
-
9
-
10
-
11
-
12
-
13
-
14
-
15
-
16
-
17
-
18
-
19
-
20
-
21
-
22
-
23
-
24
-
25
-
26
-
27
-
28
-
29
-
30
-
31
-
32
-
33
-
34
-
35
-
36
-
37
-
38
-
39
-
40
-
41
-
42
-
43
-
44
-
45
-
46
-
47
-
48
-
49
-
50
-
51
-
52
-
53
-
54
-
55
-
56
-
 57
57 -
 58
58 -
 59
59 -
 60
60 -
 61
61 -
 62
62 -
 63
63 -
 64
64 -
 65
65 -
 66
66 -
 67
67 -
 68
68 -
 69
69 -
 70
70 -
 71
71 -
 72
72 -
 73
73 -
 74
74 -
 75
75 -
 76
76 -
 77
77 -
78
-
79
-
80
-
81
-
82
-
83
-
84
-
85
-
86
-
87
-
88
-
89
-
90
-
91
-
92
-
93
-
94
-
95
-
96
-
97
-
98
-
99
-
100
-
101
-
102
-
103
-
104
-
105
-
106
-
107
-
108
-
109
-
110
-
111
-
112
-
113
-
114
-
115
-
116
-
117
-
118
-
119
-
120
-
121
-
122
-
123
-
124
-
125
-
126
-
127
-
128
-
129
-
130
-
131
-
132
-
133
-
134
-
135
-
136
-
137
-
138
-
139
-
140
-
141
-
142
-
143
-
144
-
145
-
146
-
147
-
148
-
149
-
150
-
151
-
152
-
153
-
154
-
155
-
156
-
157
-
158
-
159
-
160
-
161
-
162
-
163
-
164
-
165
-
166
-
167
-
168
-
169
-
170
-
171
-
172
-
173
-
174
-
175
-
176
-
177
-
178
-
179
-
180
-
181
-
182
-
183
-
184
-
185
-
186
-
187
-
188
-
189
-
190
-
191
-
192
-
193
-
194
-
195
-
196
-
197
-
198
-
199
-
200
-
201
-
202
-
203
-
204
-
205
-
206
-
207
-
208
-
209
-
210
-
211
-
212
-
213
-
214
-
215
-
216
-
217
-
218
-
219
-
220
-
221
-
222
-
223
-
224
-
225
-
226
-
227
-
228
-
229
-
230
-
231
-
232
-
233
-
234
-
235
-
236
-
237
-
238
-
239
-
240
-
241
-
242
-
243
-
244
-
245
-
246
-
247
-
248
-
249
-
250
-
251
-
252
-
253
-
254
-
255
-
256
-
257
-
258
-
259
-
260
-
261
-
262
-
263
-
264
-
265
-
266
-
267
-
268
-
269
-
270
-
271
-
272
-
273
-
274
-
275
-
276
-
277
-
278
-
279
-
280
-
281
-
282
-
283
-
284
-
285
-
286
-
287
-
288
-
289
-
290
-
291
-
292
-
293
-
294
-
295
-
296
-
297
-
298
-
299
-
300
-
301
-
302
-
303
-
304
-
305
-
306
-
307
-
308
-
309
-
310
-
311
-
312
-
313
-
314
-
315
-
316
-
317
-
318
-
319
-
320
-
321
-
322
-
323
-
324
-
325
-
326
-
327
-
328
-
329
-
330
-
331
-
332
-
333
-
334
-
335
-
336
-
337
-
338
-
339
-
340
-
341
-
342
-
343
-
344
-
345
-
346
-
347
-
348
-
349
-
350
-
351
-
352
-
353
-
354
-
355
-
356
-
357
-
358
-
359
-
360
-
361
-
362
-
363
-
364
-
365
-
366
-
367
-
368
-
369
-
370
-
371
-
372
-
373
-
374
-
375
-
376
-
377
-
378
 |
 |
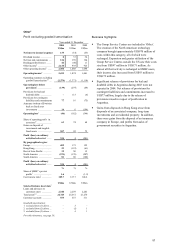
65
the planned programme to upgrade critical
infrastructure and staff skills.
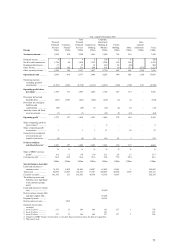
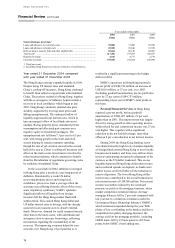
Net interest income was 16 per cent lower than
in 2003, in part reflecting the costs of funding a
higher level of equity swaps, the trading impact and
dividend benefit from which is reported in other
operating income. Global Markets earnings declined
as higher yielding assets ran off and were replaced
by investments at lower prevailing money market
rates. Market concerns over future interest rate
increases, oil prices at record highs, and the Iraq
crisis all drove down demand for credit. A reduction
in the level of customer activity led to a fall in
corporate and institutional account balances. In
Turkey, significant reductions in local interest rates
resulted in lower income streams from net free
funds.
Other operating income rose by 6 per cent to
US$3,210 million of which 2 per cent arose in Bank
of Bermuda's European operations. Adjusting for the
Bank of Bermuda acquisition, operating income
increased by US$76 million or 4 per cent. In the UK,
a US$414 million rise in dividends from equity
swaps activity reflected an increase in volumes and
size of trades, primarily driven by the growth in the
equity swaps market. This gain was partly offset by a
related decrease in dealing profits and higher fees
payable of US$354 million and funding costs of
US$38 million, reported under net interest income.
Fixed income revenues fell, mainly from lower
volatility in credit spreads and a reduced level of
corporate debt issuance. Foreign exchange and
derivatives revenue increased due to higher customer
volumes across a wider range of products, with
supplementary gains from the continued weakening
of the US dollar. Improved performance in structured
derivatives reflected the successful investment in
additional execution capabilities, while Global
Markets in Turkey experienced a boost in revenues
from foreign exchange gains and securities trading
following its integration with HSBC’s other dealing
rooms in Europe. In Germany, higher fees and
commissions were generated from investment
banking advisory business and improved volumes on
derivatives.
Costs increased by 18 per cent, of which 3 per
cent represented Bank of Bermuda. The remaining
costs reflected the restructuring of the business, with
extensive expenditure on systems and people to
improve client coverage. Overall, these
developments saw the departure of 856 staff and the
recruitment of 1,051 during the course of the year,
improving levels of proficiency and customer
delivery. Key appointments included global sector
heads for certain industry teams based in the UK and
additional senior hires in investment banking
advisory, while staff were also recruited to support
the expansion of the cash equities, options,
structured products and derivatives businesses. The
planned development of global research continued,
with the recruitment of people across a variety of
sectors and products. The restructuring of regional
research franchises into a globally managed
business, encompassing all research across all
product areas, was completed. Non-staff costs also
increased, reflecting the continued investment in
technology, including US$19 million for the
development of HSBCnet. HSBC Securities Services
incurred additional costs to develop insourcing
capabilities for third party processing.
The net release of provisions for bad and
doubtful debts, compared with a net charge in 2003,
reflected the benefit of a number of recoveries and
releases of certain provisions resulting from
successful refinancing during the year. Corporate
lending weakness in the power generation sector,
which adversely affected 2003, was not repeated.
The recoveries included sizeable amounts for a
single name in the industrial sector in France.
Gains on investment disposals were
US$210 million, reflecting the disposal of HSBC’s
interest in a number of private equity investments in
the UK and France.
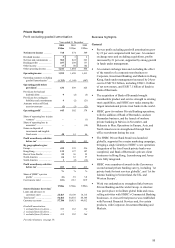
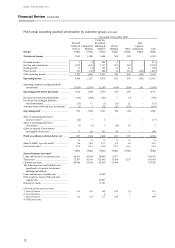
Private Banking contributed a pre-tax profit,
before goodwill amortisation, of US$432 million, an
increase of 26 per cent compared with 2003.
Growth of 19 per cent in net interest income was
driven by a 27 per cent increase in lending balances,
predominantly in the UK and Switzerland, where
clients leveraged their wealth by borrowing on a
secured basis in the low interest environment to
reinvest in higher-yielding securities or in alternative
investments. Income also benefited from a shift in
the profile of investment securities to higher-yielding
HSBC Finance Corporation paper.
Net fees and commissions increased by 11 per
cent to US$658 million. Performance fees included a
US$24 million increase in fees from the Hermitage
Fund, one of the world’s leading public equity funds
dedicated to Russia in which HSBC Private Bank
has been invested from its inception. In the UK,
commission income in HSBC’s residential property
advisory business grew strongly, supported by the
generally buoyant housing market, and increased
client referrals.
Funds under management grew by 13 per cent
to US$107.8 billion, as clients moved cash liquidity
to higher-yielding investment products in the low