HSBC 2004 Annual Report Download - page 47
Download and view the complete annual report
Please find page 47 of the 2004 HSBC annual report below. You can navigate through the pages in the report by either clicking on the pages listed below, or by using the keyword search tool below to find specific information within the annual report.-
 1
1 -
2
-
3
-
4
-
5
-
6
-
7
-
8
-
9
-
10
-
11
-
12
-
13
-
14
-
15
-
16
-
17
-
18
-
19
-
20
-
21
-
22
-
23
-
24
-
25
-
26
-
27
-
28
-
29
-
30
-
31
-
32
-
33
-
34
-
35
-
36
-
 37
37 -
 38
38 -
 39
39 -
 40
40 -
 41
41 -
 42
42 -
 43
43 -
 44
44 -
 45
45 -
 46
46 -
 47
47 -
 48
48 -
 49
49 -
 50
50 -
 51
51 -
 52
52 -
 53
53 -
 54
54 -
 55
55 -
 56
56 -
 57
57 -
58
-
59
-
60
-
61
-
62
-
63
-
64
-
65
-
66
-
67
-
68
-
69
-
70
-
71
-
72
-
73
-
74
-
75
-
76
-
77
-
78
-
79
-
80
-
81
-
82
-
83
-
84
-
85
-
86
-
87
-
88
-
89
-
90
-
91
-
92
-
93
-
94
-
95
-
96
-
97
-
98
-
99
-
100
-
101
-
102
-
103
-
104
-
105
-
106
-
107
-
108
-
109
-
110
-
111
-
112
-
113
-
114
-
115
-
116
-
117
-
118
-
119
-
120
-
121
-
122
-
123
-
124
-
125
-
126
-
127
-
128
-
129
-
130
-
131
-
132
-
133
-
134
-
135
-
136
-
137
-
138
-
139
-
140
-
141
-
142
-
143
-
144
-
145
-
146
-
147
-
148
-
149
-
150
-
151
-
152
-
153
-
154
-
155
-
156
-
157
-
158
-
159
-
160
-
161
-
162
-
163
-
164
-
165
-
166
-
167
-
168
-
169
-
170
-
171
-
172
-
173
-
174
-
175
-
176
-
177
-
178
-
179
-
180
-
181
-
182
-
183
-
184
-
185
-
186
-
187
-
188
-
189
-
190
-
191
-
192
-
193
-
194
-
195
-
196
-
197
-
198
-
199
-
200
-
201
-
202
-
203
-
204
-
205
-
206
-
207
-
208
-
209
-
210
-
211
-
212
-
213
-
214
-
215
-
216
-
217
-
218
-
219
-
220
-
221
-
222
-
223
-
224
-
225
-
226
-
227
-
228
-
229
-
230
-
231
-
232
-
233
-
234
-
235
-
236
-
237
-
238
-
239
-
240
-
241
-
242
-
243
-
244
-
245
-
246
-
247
-
248
-
249
-
250
-
251
-
252
-
253
-
254
-
255
-
256
-
257
-
258
-
259
-
260
-
261
-
262
-
263
-
264
-
265
-
266
-
267
-
268
-
269
-
270
-
271
-
272
-
273
-
274
-
275
-
276
-
277
-
278
-
279
-
280
-
281
-
282
-
283
-
284
-
285
-
286
-
287
-
288
-
289
-
290
-
291
-
292
-
293
-
294
-
295
-
296
-
297
-
298
-
299
-
300
-
301
-
302
-
303
-
304
-
305
-
306
-
307
-
308
-
309
-
310
-
311
-
312
-
313
-
314
-
315
-
316
-
317
-
318
-
319
-
320
-
321
-
322
-
323
-
324
-
325
-
326
-
327
-
328
-
329
-
330
-
331
-
332
-
333
-
334
-
335
-
336
-
337
-
338
-
339
-
340
-
341
-
342
-
343
-
344
-
345
-
346
-
347
-
348
-
349
-
350
-
351
-
352
-
353
-
354
-
355
-
356
-
357
-
358
-
359
-
360
-
361
-
362
-
363
-
364
-
365
-
366
-
367
-
368
-
369
-
370
-
371
-
372
-
373
-
374
-
375
-
376
-
377
-
378
 |
 |

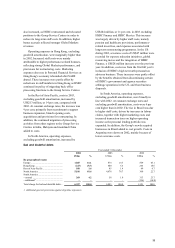
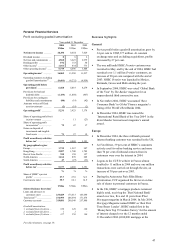
45
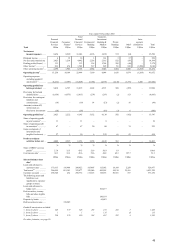
Year ended 31 December 2003
Total
Personal
Financial
Services
US$m
Consumer
Finance5
US$m
Total
Personal
Financial
Services
US$m
Commercial
Banking
US$m
Corporate,
Investment
Banking &
Markets
US$m
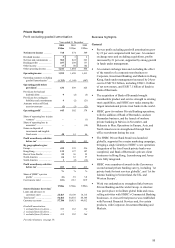
Private
Banking
US$m
Other6
US$m
Inter-
segment
elimination
US$m
Total
US$m
Net interest
income/(expense) ....... 8,654 8,289 16,943 4,196 3,899 574 (14) – 25,598
Dividend income .............. 6 12 18 3 161 3 37 – 222
Net fees and commissions 3,623 1,219 4,842 2,256 2,315 822 159 – 10,394
Dealing profits/(losses) .... 133 – 133 118 1,764 209 (46) – 2,178
Other income9 ................... 834 674 1,508 587 805 50 938 (1,208) 2,680
Other operating income9.... 4,596 1,905 6,501 2,964 5,045 1,084 1,088 (1,208) 15,474
Operating income9........... 13,250 10,194 23,444 7,160 8,944 1,658 1,074 (1,208) 41,072
Operating expenses
excluding goodwill
amortisation1,9.............. (8,232) (3,397) (11,629) (3,768) (4,373) (1,149) (1,371) 1,208 (21,082)
Operating profit/(loss)
before provisions1 ..... 5,018 6,797 11,815 3,392 4,571 509 (297) – 19,990
Provisions for bad and
doubtful debts ............. (1,058) (4,575) (5,633) (274) (297) (2) 113 – (6,093)
Provisions for contingent
liabilities and
commitments ............... (19) – (19) 14 (53) (2) 16 – (44)
Amounts (written off)/
written back on
fixed asset investments (18) – (18) – (91) (3) 6 – (106)
Operating profit/(loss)1 .. 3,923 2,222 6,145 3,132 4,130 502 (162) – 13,747
Share of operating profit
in joint ventures2 ......... 11 – 11 – 8 – – – 19
Share of operating profit
in associates2............... 47 – 47 20 80 – 74 – 221
Gains on disposal of
investments and
tangible fixed assets .... 27 3 30 6 225 61 92 – 414
Profit on ordinary
activities before tax3 .. 4,008 2,225 6,233 3,158 4,443 563 4 – 14,401
%%%%%%% %
Share of HSBC’ s pre-tax
profits3 ........................ 27.8 15.5 43.3 21.9 30.9 3.9 – 100.0
Cost:income ratio1 ............ 62.1 33.3 49.6 52.6 48.9 69.3 127.7 51.3
US$m US$m US$m US$m US$m US$m US$m US$m
Selected balance sheet
data7
Loans and advances to
customers (net) ........... 173,613 116,409 290,022 103,495 115,092 18,109 2,259 528,977
Total assets8,9 ................... 206,694 145,383 352,077 128,086 462,995 54,510 25,561 1,023,229
Customer accounts ........... 290,540 232 290,772 111,515 119,335 50,951 557 573,130
The following assets and
liabilities were
significant to customer
groups as noted:
Loans and advances to
banks (net) .................. 101,277
Debt securities, treasury
bills and other eligible
bills ............................. 186,139
Deposits by banks ............ 65,882
Debt securities in issue...... 110,905
Goodwill amortisation excluded:
1from (1) above ............. 249 379 628 263 272 282 5 1,450
2from (2) above ............. 1 – 1 – 135 – (1) 135
3from (3) above ............. 250 379 629 263 407 282 4 1,585
For other footnotes, see page 59.