HSBC 2004 Annual Report Download - page 38
Download and view the complete annual report
Please find page 38 of the 2004 HSBC annual report below. You can navigate through the pages in the report by either clicking on the pages listed below, or by using the keyword search tool below to find specific information within the annual report.-
 1
1 -
2
-
3
-
4
-
5
-
6
-
7
-
8
-
9
-
10
-
11
-
12
-
13
-
14
-
15
-
16
-
17
-
18
-
19
-
20
-
21
-
22
-
23
-
24
-
25
-
26
-
27
-
 28
28 -
 29
29 -
 30
30 -
 31
31 -
 32
32 -
 33
33 -
 34
34 -
 35
35 -
 36
36 -
 37
37 -
 38
38 -
 39
39 -
 40
40 -
 41
41 -
 42
42 -
 43
43 -
 44
44 -
 45
45 -
 46
46 -
 47
47 -
 48
48 -
49
-
50
-
51
-
52
-
53
-
54
-
55
-
56
-
57
-
58
-
59
-
60
-
61
-
62
-
63
-
64
-
65
-
66
-
67
-
68
-
69
-
70
-
71
-
72
-
73
-
74
-
75
-
76
-
77
-
78
-
79
-
80
-
81
-
82
-
83
-
84
-
85
-
86
-
87
-
88
-
89
-
90
-
91
-
92
-
93
-
94
-
95
-
96
-
97
-
98
-
99
-
100
-
101
-
102
-
103
-
104
-
105
-
106
-
107
-
108
-
109
-
110
-
111
-
112
-
113
-
114
-
115
-
116
-
117
-
118
-
119
-
120
-
121
-
122
-
123
-
124
-
125
-
126
-
127
-
128
-
129
-
130
-
131
-
132
-
133
-
134
-
135
-
136
-
137
-
138
-
139
-
140
-
141
-
142
-
143
-
144
-
145
-
146
-
147
-
148
-
149
-
150
-
151
-
152
-
153
-
154
-
155
-
156
-
157
-
158
-
159
-
160
-
161
-
162
-
163
-
164
-
165
-
166
-
167
-
168
-
169
-
170
-
171
-
172
-
173
-
174
-
175
-
176
-
177
-
178
-
179
-
180
-
181
-
182
-
183
-
184
-
185
-
186
-
187
-
188
-
189
-
190
-
191
-
192
-
193
-
194
-
195
-
196
-
197
-
198
-
199
-
200
-
201
-
202
-
203
-
204
-
205
-
206
-
207
-
208
-
209
-
210
-
211
-
212
-
213
-
214
-
215
-
216
-
217
-
218
-
219
-
220
-
221
-
222
-
223
-
224
-
225
-
226
-
227
-
228
-
229
-
230
-
231
-
232
-
233
-
234
-
235
-
236
-
237
-
238
-
239
-
240
-
241
-
242
-
243
-
244
-
245
-
246
-
247
-
248
-
249
-
250
-
251
-
252
-
253
-
254
-
255
-
256
-
257
-
258
-
259
-
260
-
261
-
262
-
263
-
264
-
265
-
266
-
267
-
268
-
269
-
270
-
271
-
272
-
273
-
274
-
275
-
276
-
277
-
278
-
279
-
280
-
281
-
282
-
283
-
284
-
285
-
286
-
287
-
288
-
289
-
290
-
291
-
292
-
293
-
294
-
295
-
296
-
297
-
298
-
299
-
300
-
301
-
302
-
303
-
304
-
305
-
306
-
307
-
308
-
309
-
310
-
311
-
312
-
313
-
314
-
315
-
316
-
317
-
318
-
319
-
320
-
321
-
322
-
323
-
324
-
325
-
326
-
327
-
328
-
329
-
330
-
331
-
332
-
333
-
334
-
335
-
336
-
337
-
338
-
339
-
340
-
341
-
342
-
343
-
344
-
345
-
346
-
347
-
348
-
349
-
350
-
351
-
352
-
353
-
354
-
355
-
356
-
357
-
358
-
359
-
360
-
361
-
362
-
363
-
364
-
365
-
366
-
367
-
368
-
369
-
370
-
371
-
372
-
373
-
374
-
375
-
376
-
377
-
378
 |
 |

HSBC HOLDINGS PLC
Financial Review (continued)
36
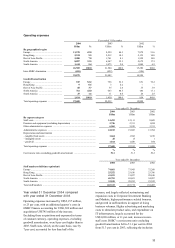
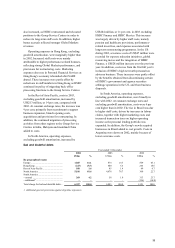
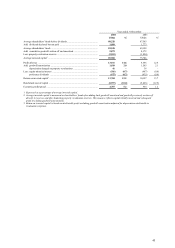
Year ended 31 December
2004 2003 2002
US$m US$m US$m
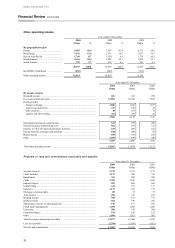
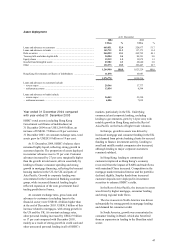
Specific provisions
New provisions .............................................................................................. 8,989 7,777 2,678
Release of provisions no longer required ....................................................... (1,284) (953) (826)
Recoveries of amounts previously written off ................................................ (912) (610) (180)
6,793 6,214 1,672
General provisions
Argentine additional provision ....................................................................... –– (196)
Other .............................................................................................................. (436) (121) (155)
(436) (121) (351)
Total ............................................................................................................... 6,357 6,093 1,321
Customer non-performing loans ..................................................................... 13,259 15,050 10,523
Customer bad and doubtful debt provisions ................................................... 12,669 13,691 9,117
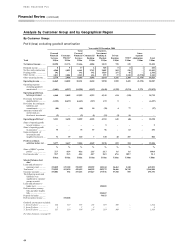
Year ended 31 December 2004 compared
with year ended 31 December 2003
At 31 December 2004, 78 per cent of customer
lending was located in Europe and North America,
with 12 per cent in Hong Kong. Personal lending
accounted for 57 per cent of the customer loan
portfolio, a marginal increase on the position at
31 December 2003.
Excluding the effect of foreign exchange
translation, over 70 per cent of loan growth in 2004,
excluding the financial sector, was generated in
personal lending, with particularly strong growth in
mortgages and consumer lending.
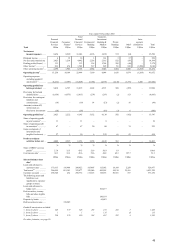
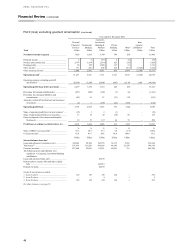
Over 100 per cent of the net charge for bad and
doubtful debts in 2004 related to lending to the
personal sector, including consumer finance,
compared with 90 per cent in 2003. Similarly, some
95 per cent of the charge related to lending in the US
and Europe, compared with 88 per cent in 2003.
The charge for specific bad and doubtful debts
adjusts the specific balance sheet provisions to the
level that management deems adequate to absorb
actual and inherent losses in the Group’s loan
portfolio from homogeneous portfolios of assets and
individually identified customer loans. The majority
of specific provisions are determined on a portfolio
basis employing statistical calculations using roll
rate methodology to determine specific provisions
for bad and doubtful debts. There were no significant
changes to the procedures used by HSBC in
determining the various components of the charge
for specific bad and doubtful debts during the year.
The charge for specific provisions in 2004 was
US$6,793 million compared with US$6,214 million
in 2003, an increase of US$579 million. With the
additional quarter’s charge from HSBC Finance and
the acquisitions during the year together adding
US$1,433 million to the overall charge, the
underlying movement at constant currencies was a
decrease of US$979 million. New specific
provisions increased by US$1,212 million, reflecting
the additional quarter’s charge for HSBC Finance of
US$1,367 million and the US$205 million effect of
acquisitions during the year. Excluding these and at
constant currencies, new specific provisions fell by
US$537 million, or 7 per cent, compared with 2003
with lower new provisions in Hong Kong and the US
combined with higher releases and recoveries in
Europe, North America and South America.
General provisions augment specific provisions
and provide cover for loans which are impaired at
the balance sheet date but which will not be
individually identified as such until some time in the
future. In determining the level of general
provisions, management takes account of historical
loss experience, the estimated period between a loss
occurring and that loss being identified, and use their
judgement to decide whether current economic
conditions are likely to produce credit default rates
and loss severity in line with historical precedent.
There was a net general provision release of
US$436 million in 2004, US$315 million greater
than the net release of US$121 million in 2003.
Releases increased in all geographical regions except
South America. This reflected improved underlying
economic conditions, driving lower loss
expectations, and progress made with refinancing
and restructuring problem credits.
The aggregate customer bad and doubtful debt
provisions at 31 December 2004 of US$12.7 billion
represented 1.98 per cent of gross customer advances
(net of suspended interest, reverse repos and
settlement accounts) compared with 2.65 per cent at
31 December 2003. As in 2003, HSBC’s cross-
border exposures did not necessitate significant
provisions.