HSBC 2004 Annual Report Download - page 183
Download and view the complete annual report
Please find page 183 of the 2004 HSBC annual report below. You can navigate through the pages in the report by either clicking on the pages listed below, or by using the keyword search tool below to find specific information within the annual report.-
 1
1 -
2
-
3
-
4
-
5
-
6
-
7
-
8
-
9
-
10
-
11
-
12
-
13
-
14
-
15
-
16
-
17
-
18
-
19
-
20
-
21
-
22
-
23
-
24
-
25
-
26
-
27
-
28
-
29
-
30
-
31
-
32
-
33
-
34
-
35
-
36
-
37
-
38
-
39
-
40
-
41
-
42
-
43
-
44
-
45
-
46
-
47
-
48
-
49
-
50
-
51
-
52
-
53
-
54
-
55
-
56
-
57
-
58
-
59
-
60
-
61
-
62
-
63
-
64
-
65
-
66
-
67
-
68
-
69
-
70
-
71
-
72
-
73
-
74
-
75
-
76
-
77
-
78
-
79
-
80
-
81
-
82
-
83
-
84
-
85
-
86
-
87
-
88
-
89
-
90
-
91
-
92
-
93
-
94
-
95
-
96
-
97
-
98
-
99
-
100
-
101
-
102
-
103
-
104
-
105
-
106
-
107
-
108
-
109
-
110
-
111
-
112
-
113
-
114
-
115
-
116
-
117
-
118
-
119
-
120
-
121
-
122
-
123
-
124
-
125
-
126
-
127
-
128
-
129
-
130
-
131
-
132
-
133
-
134
-
135
-
136
-
137
-
138
-
139
-
140
-
141
-
142
-
143
-
144
-
145
-
146
-
147
-
148
-
149
-
150
-
151
-
152
-
153
-
154
-
155
-
156
-
157
-
158
-
159
-
160
-
161
-
162
-
163
-
164
-
165
-
166
-
167
-
168
-
169
-
170
-
171
-
172
-
 173
173 -
 174
174 -
 175
175 -
 176
176 -
 177
177 -
 178
178 -
 179
179 -
 180
180 -
 181
181 -
 182
182 -
 183
183 -
 184
184 -
 185
185 -
 186
186 -
 187
187 -
 188
188 -
 189
189 -
 190
190 -
 191
191 -
 192
192 -
 193
193 -
194
-
195
-
196
-
197
-
198
-
199
-
200
-
201
-
202
-
203
-
204
-
205
-
206
-
207
-
208
-
209
-
210
-
211
-
212
-
213
-
214
-
215
-
216
-
217
-
218
-
219
-
220
-
221
-
222
-
223
-
224
-
225
-
226
-
227
-
228
-
229
-
230
-
231
-
232
-
233
-
234
-
235
-
236
-
237
-
238
-
239
-
240
-
241
-
242
-
243
-
244
-
245
-
246
-
247
-
248
-
249
-
250
-
251
-
252
-
253
-
254
-
255
-
256
-
257
-
258
-
259
-
260
-
261
-
262
-
263
-
264
-
265
-
266
-
267
-
268
-
269
-
270
-
271
-
272
-
273
-
274
-
275
-
276
-
277
-
278
-
279
-
280
-
281
-
282
-
283
-
284
-
285
-
286
-
287
-
288
-
289
-
290
-
291
-
292
-
293
-
294
-
295
-
296
-
297
-
298
-
299
-
300
-
301
-
302
-
303
-
304
-
305
-
306
-
307
-
308
-
309
-
310
-
311
-
312
-
313
-
314
-
315
-
316
-
317
-
318
-
319
-
320
-
321
-
322
-
323
-
324
-
325
-
326
-
327
-
328
-
329
-
330
-
331
-
332
-
333
-
334
-
335
-
336
-
337
-
338
-
339
-
340
-
341
-
342
-
343
-
344
-
345
-
346
-
347
-
348
-
349
-
350
-
351
-
352
-
353
-
354
-
355
-
356
-
357
-
358
-
359
-
360
-
361
-
362
-
363
-
364
-
365
-
366
-
367
-
368
-
369
-
370
-
371
-
372
-
373
-
374
-
375
-
376
-
377
-
378
 |
 |

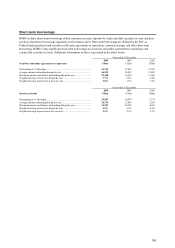
181
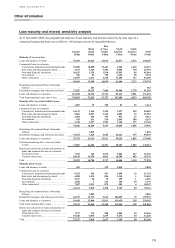
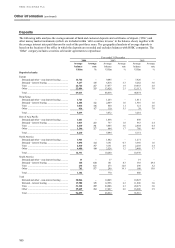
Year ended 31 December
2004 2003 2002
Average
balance
Average
rate
Average
balance
Average
rate
Average
balance
Average
rate
US$m % US$m % US$m %
Customer accounts
Europe
Demand and other – non-interest bearing .. 37,396 – 30,667 – 29,109 –
Demand – interest bearing ......................... 128,382 2.0 101,189 1.8 77,835 2.0
Savings ...................................................... 37,846 2.5 33,876 2.3 23,587 2.9
Time ......................................................... 48,314 3.1 41,010 2.8 44,745 3.1
Other .......................................................... 15,167 2.2 9,696 3.6 6,621 6.4
Total .......................................................... 267,105 216,438 181,897
Hong Kong
Demand and other – non-interest bearing .. 13,523 – 8,829
–
6,743
–
Demand – interest bearing ......................... 94,637 0.1 74,818 0.1 62,922 0.3
Savings ...................................................... 46,817 1.0 58,646 0.9 65,914 1.2
Time .......................................................... 12,015 1.6 10,101 1.4 8,630 1.9
Other .......................................................... 106 4.7 379 1.3 413 1.2
Total .......................................................... 167,098 152,773 144,622
Rest of Asia-Pacific
Demand and other – non-interest bearing .. 8,592 – 6,467
–
4,913
–
Demand – interest bearing ......................... 24,480 1.2 18,483 1.1 13,903 1.3
Savings ...................................................... 27,171 2.9 25,685 2.7 23,711 3.1
Time .......................................................... 7,597 2.1 6,105 1.6 5,508 2.0
Other .......................................................... 2,866 1.2 2,304 1.2 1,338 2.3
Total .......................................................... 70,706 59,044 49,373
North America
Demand and other – non-interest bearing .. 21,409 – 21,364
–
14,412
–
Demand – interest bearing ......................... 16,394 1.0 11,648 1.3 7,088 1.7
Savings ...................................................... 52,485 1.3 48,295 1.2 44,913 1.4
Time .......................................................... 13,856 2.4 6,652 3.3 6,266 4.9
Other .......................................................... 16,988 2.7 11,672 3.3 10,219 2.3
Total .......................................................... 121,132 99,631 82,898
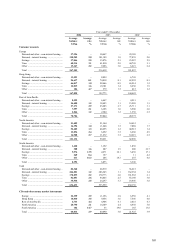
South America
Demand and other – non-interest bearing .. 1,428 – 1,192
–
1,038
–
Demand – interest bearing ......................... 308 1.6 207 1.9 606 21.7
Savings ...................................................... 5,976 13.5 4,271 18.1 3,438 17.1
Time .......................................................... 269 0.4 157
–
11 4.2
Other .......................................................... 411 16.3 246 18.3 255 4.8
Total .......................................................... 8,392 6,073 5,348
Total
Demand and other – non-interest bearing .. 82,348 – 68,519
–
56,215
–
Demand – interest bearing ......................... 264,201 1.2 206,345 1.1 162,354 1.4
Savings ...................................................... 170,295 2.2 170,773 2.0 161,563 2.1
Time .......................................................... 82,051 2.6 64,025 2.5 65,160 3.0
Other .......................................................... 35,538 2.5 24,297 3.3 18,846 3.8
Total .......................................................... 634,433 533,959 464,138
CDs and other money market instruments
Europe ....................................................... 22,359 2.9 11,156 2.8 6,958 4.1
Hong Kong ................................................ 10,830 3.5 9,656 3.6 7,546 4.0
Rest of Asia-Pacific ................................... 6,733 4.4 4,906 4.1 2,418 4.3
North America ........................................... 20,790 2.1 14,309 2.4 4,838 3.0
South America ........................................... 102 14.7 63 19.0 165 13.8
Total .......................................................... 60,814 2.9 40,090 3.0 21,925 3.9