HSBC 2004 Annual Report Download - page 48
Download and view the complete annual report
Please find page 48 of the 2004 HSBC annual report below. You can navigate through the pages in the report by either clicking on the pages listed below, or by using the keyword search tool below to find specific information within the annual report.-
 1
1 -
2
-
3
-
4
-
5
-
6
-
7
-
8
-
9
-
10
-
11
-
12
-
13
-
14
-
15
-
16
-
17
-
18
-
19
-
20
-
21
-
22
-
23
-
24
-
25
-
26
-
27
-
28
-
29
-
30
-
31
-
32
-
33
-
34
-
35
-
36
-
37
-
 38
38 -
 39
39 -
 40
40 -
 41
41 -
 42
42 -
 43
43 -
 44
44 -
 45
45 -
 46
46 -
 47
47 -
 48
48 -
 49
49 -
 50
50 -
 51
51 -
 52
52 -
 53
53 -
 54
54 -
 55
55 -
 56
56 -
 57
57 -
 58
58 -
59
-
60
-
61
-
62
-
63
-
64
-
65
-
66
-
67
-
68
-
69
-
70
-
71
-
72
-
73
-
74
-
75
-
76
-
77
-
78
-
79
-
80
-
81
-
82
-
83
-
84
-
85
-
86
-
87
-
88
-
89
-
90
-
91
-
92
-
93
-
94
-
95
-
96
-
97
-
98
-
99
-
100
-
101
-
102
-
103
-
104
-
105
-
106
-
107
-
108
-
109
-
110
-
111
-
112
-
113
-
114
-
115
-
116
-
117
-
118
-
119
-
120
-
121
-
122
-
123
-
124
-
125
-
126
-
127
-
128
-
129
-
130
-
131
-
132
-
133
-
134
-
135
-
136
-
137
-
138
-
139
-
140
-
141
-
142
-
143
-
144
-
145
-
146
-
147
-
148
-
149
-
150
-
151
-
152
-
153
-
154
-
155
-
156
-
157
-
158
-
159
-
160
-
161
-
162
-
163
-
164
-
165
-
166
-
167
-
168
-
169
-
170
-
171
-
172
-
173
-
174
-
175
-
176
-
177
-
178
-
179
-
180
-
181
-
182
-
183
-
184
-
185
-
186
-
187
-
188
-
189
-
190
-
191
-
192
-
193
-
194
-
195
-
196
-
197
-
198
-
199
-
200
-
201
-
202
-
203
-
204
-
205
-
206
-
207
-
208
-
209
-
210
-
211
-
212
-
213
-
214
-
215
-
216
-
217
-
218
-
219
-
220
-
221
-
222
-
223
-
224
-
225
-
226
-
227
-
228
-
229
-
230
-
231
-
232
-
233
-
234
-
235
-
236
-
237
-
238
-
239
-
240
-
241
-
242
-
243
-
244
-
245
-
246
-
247
-
248
-
249
-
250
-
251
-
252
-
253
-
254
-
255
-
256
-
257
-
258
-
259
-
260
-
261
-
262
-
263
-
264
-
265
-
266
-
267
-
268
-
269
-
270
-
271
-
272
-
273
-
274
-
275
-
276
-
277
-
278
-
279
-
280
-
281
-
282
-
283
-
284
-
285
-
286
-
287
-
288
-
289
-
290
-
291
-
292
-
293
-
294
-
295
-
296
-
297
-
298
-
299
-
300
-
301
-
302
-
303
-
304
-
305
-
306
-
307
-
308
-
309
-
310
-
311
-
312
-
313
-
314
-
315
-
316
-
317
-
318
-
319
-
320
-
321
-
322
-
323
-
324
-
325
-
326
-
327
-
328
-
329
-
330
-
331
-
332
-
333
-
334
-
335
-
336
-
337
-
338
-
339
-
340
-
341
-
342
-
343
-
344
-
345
-
346
-
347
-
348
-
349
-
350
-
351
-
352
-
353
-
354
-
355
-
356
-
357
-
358
-
359
-
360
-
361
-
362
-
363
-
364
-
365
-
366
-
367
-
368
-
369
-
370
-
371
-
372
-
373
-
374
-
375
-
376
-
377
-
378
 |
 |

HSBC HOLDINGS PLC
Financial Review (continued)
46
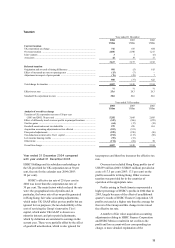
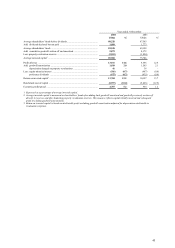
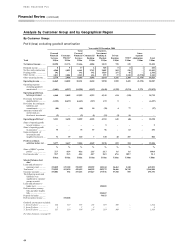
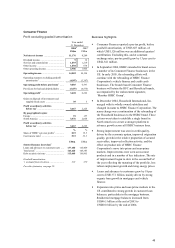
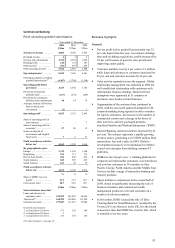
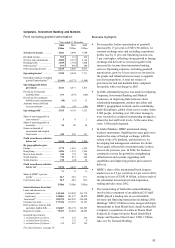
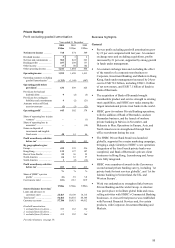
Profit/(loss) excluding goodwill amortisation (continued)
Year ended 31 December 2002
Total
Personal
Financial
Services
US$m
Commercial
Banking
US$m
Corporate,
Investment
Banking &
Markets
US$m
Private
Banking
US$m
Other6
US$m
Inter-
segment
elimination
US$m
Total
US$m
Net interest income/(expense) ............................... 7,429 3,835 3,700 549 (53) – 15,460
Dividend income ..................................................... 6 6 230 2 34 – 278
Net fees and commissions ....................................... 2,979 1,934 2,164 623 124 – 7,824
Dealing profits ........................................................ 50 107 1,008 137 11 – 1,313
Other income9.......................................................... 773 459 609 102 925 (1,148) 1,720
Other operating income9........................................... 3,808 2,506 4,011 864 1,094 (1,148) 11,135
Operating income9.................................................. 11,237 6,341 7,711 1,413 1,041 (1,148) 26,595
Operating expenses excluding goodwill
amortisation1,9 .................................................... (6,958) (3,149) (3,898) (987) (1,110) 1,148 (14,954)
Operating profit/(loss) before provisions1............. 4,279 3,192 3,813 426 (69) – 11,641
Provisions for bad and doubtful debts ..................... (857) (269) (184) (5) (6) – (1,321)
Provisions for contingent liabilities and
commitments ..................................................... (42) 19 12 (21) (75) – (107)
Amounts (written off)/written back on fixed asset
investments ........................................................ (2) 3 (109) (22) (194) – (324)
Operating profit/(loss)1.......................................... 3,378 2,945 3,532 378 (344) – 9,889
Share of operating profit/(loss) in joint ventures2 .... (23) 3 2 (1) – – (19)
Share of operating profit/(loss) in associates ............ 17 15 45 (10) 68 – 135
Gains on disposal of investments and tangible
fixed assets ........................................................ 19 51 317 46 75 – 508
Profit/(loss) on ordinary activities before tax3...... 3,391 3,014 3,896 413 (201) – 10,513
%%%%% %
Share of HSBC’ s pre-tax profits3............................. 32.3 28.7 37.1 3.8 (1.9) 100.0
Cost:income ratio1.................................................... 61.9 49.7 50.6 69.9 106.6 56.2
US$m US$m US$m US$m US$m US$m
Selected balance sheet data7
Loans and advances to customers (net) ................... 143,696 90,562 101,770 14,115 2,201 352,344
Total assets8,9 ........................................................... 171,478 113,520 394,540 48,346 21,276 749,160
Customer accounts .................................................. 257,880 92,884 95,351 49,012 311 495,438
The following assets and liabilities were
significant to Corporate, Investment Banking
and Markets:
Loans and advances banks (net) .............................. 80,870
Debt securities, treasury bills and other eligible
bills .................................................................... 162,583
Deposits by banks ................................................... 48,895
Goodwill amortisation excluded:
1from (1) above .................................................... 186 168 236 264 –854
2from (2) above .................................................... – – 8–19
3from (3) above .................................................... 186 168 244 264 1 863
For other footnotes, see page 59.