HSBC 2004 Annual Report Download - page 357
Download and view the complete annual report
Please find page 357 of the 2004 HSBC annual report below. You can navigate through the pages in the report by either clicking on the pages listed below, or by using the keyword search tool below to find specific information within the annual report.-
 1
1 -
2
-
3
-
4
-
5
-
6
-
7
-
8
-
9
-
10
-
11
-
12
-
13
-
14
-
15
-
16
-
17
-
18
-
19
-
20
-
21
-
22
-
23
-
24
-
25
-
26
-
27
-
28
-
29
-
30
-
31
-
32
-
33
-
34
-
35
-
36
-
37
-
38
-
39
-
40
-
41
-
42
-
43
-
44
-
45
-
46
-
47
-
48
-
49
-
50
-
51
-
52
-
53
-
54
-
55
-
56
-
57
-
58
-
59
-
60
-
61
-
62
-
63
-
64
-
65
-
66
-
67
-
68
-
69
-
70
-
71
-
72
-
73
-
74
-
75
-
76
-
77
-
78
-
79
-
80
-
81
-
82
-
83
-
84
-
85
-
86
-
87
-
88
-
89
-
90
-
91
-
92
-
93
-
94
-
95
-
96
-
97
-
98
-
99
-
100
-
101
-
102
-
103
-
104
-
105
-
106
-
107
-
108
-
109
-
110
-
111
-
112
-
113
-
114
-
115
-
116
-
117
-
118
-
119
-
120
-
121
-
122
-
123
-
124
-
125
-
126
-
127
-
128
-
129
-
130
-
131
-
132
-
133
-
134
-
135
-
136
-
137
-
138
-
139
-
140
-
141
-
142
-
143
-
144
-
145
-
146
-
147
-
148
-
149
-
150
-
151
-
152
-
153
-
154
-
155
-
156
-
157
-
158
-
159
-
160
-
161
-
162
-
163
-
164
-
165
-
166
-
167
-
168
-
169
-
170
-
171
-
172
-
173
-
174
-
175
-
176
-
177
-
178
-
179
-
180
-
181
-
182
-
183
-
184
-
185
-
186
-
187
-
188
-
189
-
190
-
191
-
192
-
193
-
194
-
195
-
196
-
197
-
198
-
199
-
200
-
201
-
202
-
203
-
204
-
205
-
206
-
207
-
208
-
209
-
210
-
211
-
212
-
213
-
214
-
215
-
216
-
217
-
218
-
219
-
220
-
221
-
222
-
223
-
224
-
225
-
226
-
227
-
228
-
229
-
230
-
231
-
232
-
233
-
234
-
235
-
236
-
237
-
238
-
239
-
240
-
241
-
242
-
243
-
244
-
245
-
246
-
247
-
248
-
249
-
250
-
251
-
252
-
253
-
254
-
255
-
256
-
257
-
258
-
259
-
260
-
261
-
262
-
263
-
264
-
265
-
266
-
267
-
268
-
269
-
270
-
271
-
272
-
273
-
274
-
275
-
276
-
277
-
278
-
279
-
280
-
281
-
282
-
283
-
284
-
285
-
286
-
287
-
288
-
289
-
290
-
291
-
292
-
293
-
294
-
295
-
296
-
297
-
298
-
299
-
300
-
301
-
302
-
303
-
304
-
305
-
306
-
307
-
308
-
309
-
310
-
311
-
312
-
313
-
314
-
315
-
316
-
317
-
318
-
319
-
320
-
321
-
322
-
323
-
324
-
325
-
326
-
327
-
328
-
329
-
330
-
331
-
332
-
333
-
334
-
335
-
336
-
337
-
338
-
339
-
340
-
341
-
342
-
343
-
344
-
345
-
346
-
 347
347 -
 348
348 -
 349
349 -
 350
350 -
 351
351 -
 352
352 -
 353
353 -
 354
354 -
 355
355 -
 356
356 -
 357
357 -
 358
358 -
 359
359 -
 360
360 -
 361
361 -
 362
362 -
 363
363 -
 364
364 -
 365
365 -
 366
366 -
 367
367 -
368
-
369
-
370
-
371
-
372
-
373
-
374
-
375
-
376
-
377
-
378
 |
 |
355
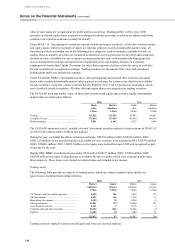
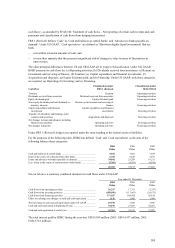
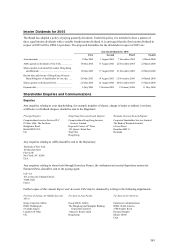
US$30.3 billion in 2004 (2003: US$25.0 billion). Net gains (gross gains less estimated credit losses under the
recourse provisions) related to these replenishments were calculated using weighted-average assumptions
consistent with those used for calculating gains on initial securitisations and totalled US$414 million in 2004
(2003: US$412 million).
Cash flows received from securitisation trusts were as follows:
2004
Real Estate
Secured
Auto
Finance
MasterCard/
Visa
Private
Label
Personal
Non-Credit
Card Total
US$m US$m US$m US$m US$m US$m
Proceeds from initial
securitisations...................... – – 550 190 – 740
Servicing fees received ............ 1 86 185 93 161 526
Other cash flow received on
retained interests1................ 4 (9) 705 252 80 1,032
2003
Proceeds from initial
securitisations...................... – 1,158 350 1,050 2,810 5,368
Servicing fees received ............ 2 86 149 65 100 402
Other cash flow received on
retained interests1................ 8 50 635 193 132 1,018
1Other cash flows included all cash flows from interest-only strip receivables, excluding servicing fees.
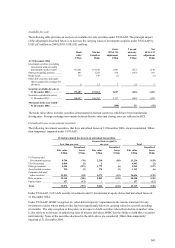
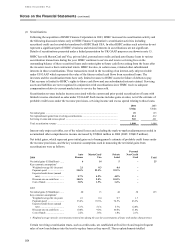
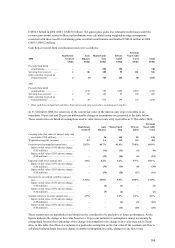
At 31 December 2004, the sensitivity of the current fair value of the interest-only strip receivables to an
immediate 10 per cent and 20 per cent unfavourable change in assumptions are presented in the table below.
These sensitivities are based on assumptions used to value interest-only strip receivables at 31 December 2004.
Real Estate
Secured
Auto
Finance
MasterCard/
Visa
Private
Label
Personal
Non-Credit
Card
Carrying value (fair value) of interest- only strip
receivables (US$ millions) ............................. 1 36 162 50 124
Weighted-average life (in years) ......................... 0.3 1.6 0.5 0.5 0.9
Payment speed assumption (annual rate) ............. 21.5% 44.7% 81.4% 79.0% 69.9%
Impact on fair value of 10% adverse change
(US$ millions) ............................................ – (16) (13) (3) (8)
Impact on fair value of 20% adverse change
(US$ millions) ............................................ – (33) (24) (5) (15)
Expected credit losses (annual rate) .................... 1.8% 8.2% 5.2% 5.7% 10.1%
Impact on fair value of 10% adverse change
(US$ millions) ............................................ – (30) (14) (8) (30)
Impact on fair value of 20% adverse change
(US$ millions) ............................................ – (59) (28) (17) (61)
Discount rate on residual cash flows (annual
rate) ................................................................. 13.0% 10.0% 9.0% 10.0% 11.0%
Impact on fair value of 10% adverse change
(US$ millions) ............................................ –(4)(1)–(1)
Impact on fair value of 20% adverse change
(US$ millions) ............................................ –(9)(2)–(2)
Variable returns to investors (annual rate) ........... 1.7% – 1.9% 3.1% 3.3%
Impact on fair value of 10% adverse change
(US$ millions) ............................................ – – (6) (5) (10)
Impact on fair value of 20% adverse change
(US$ millions)............................................. – – (13) (10) (20)
These sensitivities are hypothetical and should not be considered to be predictive of future performance. As the
figures indicate, the change in fair value based on a 10 per cent variation in assumptions cannot necessarily be
extrapolated because the relationship of the change in assumption to the change in fair value may not be linear.
Also, in this table, the effect of a variation in a particular assumption on the fair value of the residual cash flow is
calculated independently from any change in another assumption. In reality, changes in one factor may