Experian 2009 Annual Report Download - page 95
Download and view the complete annual report
Please find page 95 of the 2009 Experian annual report below. You can navigate through the pages in the report by either clicking on the pages listed below, or by using the keyword search tool below to find specific information within the annual report.-
 1
1 -
2
-
3
-
4
-
5
-
6
-
7
-
8
-
9
-
10
-
11
-
12
-
13
-
14
-
15
-
16
-
17
-
18
-
19
-
20
-
21
-
22
-
23
-
24
-
25
-
26
-
27
-
28
-
29
-
30
-
31
-
32
-
33
-
34
-
35
-
36
-
37
-
38
-
39
-
40
-
41
-
42
-
43
-
44
-
45
-
46
-
47
-
48
-
49
-
50
-
51
-
52
-
53
-
54
-
55
-
56
-
57
-
58
-
59
-
60
-
61
-
62
-
63
-
64
-
65
-
66
-
67
-
68
-
69
-
70
-
71
-
72
-
73
-
74
-
75
-
76
-
77
-
78
-
79
-
80
-
81
-
82
-
83
-
84
-
 85
85 -
 86
86 -
 87
87 -
 88
88 -
 89
89 -
 90
90 -
 91
91 -
 92
92 -
 93
93 -
 94
94 -
 95
95 -
 96
96 -
 97
97 -
 98
98 -
 99
99 -
 100
100 -
 101
101 -
 102
102 -
 103
103 -
 104
104 -
 105
105 -
106
-
107
-
108
-
109
-
110
-
111
-
112
-
113
-
114
-
115
-
116
-
117
-
118
-
119
-
120
-
121
-
122
-
123
-
124
-
125
-
126
-
127
-
128
-
129
-
130
-
131
-
132
-
133
-
134
-
135
-
136
-
137
-
138
-
139
-
140
-
141
-
142
-
143
-
144
-
145
-
146
-
147
-
148
-
149
-
150
-
151
-
152
 |
 |

93Experian Annual Report 2009
Introduction
2 – 7
Business review
8 – 43
Governance
44 – 72
Financial statements
Group nancial statements
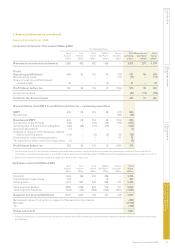
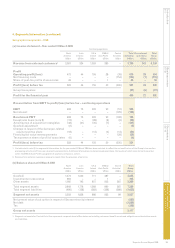
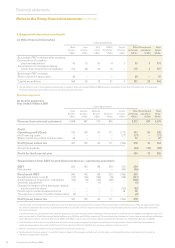
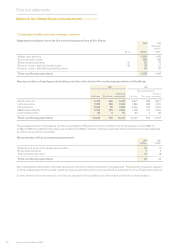
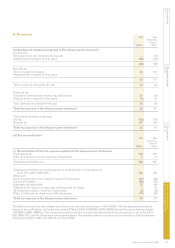
4. Segmental information (continued)
Geographical segments – 2009
(a) Income statement – Year ended 31 March 2009
Continuing operations
North Latin UK & EMEA/ Central Total Discontinued Total
America America Ireland Asia Pacific Activities continuing operations1 Group
US$m US$m US$m US$m US$m US$m US$m US$m
Revenue from external customers2 2,083 462 902 426 – 3,873 201 4,074
Prot
Operating prot/(loss) 456 80 140 16 (79) 613 26 639
Net nancing costs – – – – (77) (77) – (77)
Share of post-tax prots/(losses)
of associates 46 – – (4) – 42 – 42
Prot/(loss) before tax 502 80 140 12 (156) 578 26 604
Group tax expense (84) (14) (98)
Prot for the nancial year 494 12 506
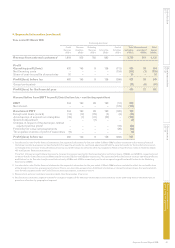
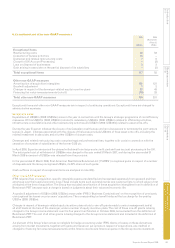
Reconciliation from EBIT to prot/(loss) before tax – continuing operations
EBIT 616 118 213 49 (57) 939
Net interest – – – – (96) (96)
Benchmark PBT 616 118 213 49 (153) 843
Exceptional items (note 8) (49) – (30) (22) (16) (117)
Amortisation of acquisition intangibles (48) (38) (34) (12) – (132)
Goodwill adjustment (1) – – – – (1)
Charges in respect of the demerger-related
equity incentive plans (14) – (9) (3) (6) (32)
Financing fair value remeasurements – – – – 19 19
Tax expense on share of prot of associates (2) – – – – (2)
Prot/(loss) before tax 502 80 140 12 (156) 578
1. As indicated in note 2 to the nancial statements, discontinued operations comprise the Group’s transaction processing activities in France. Additional
information on discontinued operations, the results of which were formerly reported within the EMEA/Asia Pacic geographical segment, is shown in note 11.
2. Revenue from external customers arose principally from the provision of services.
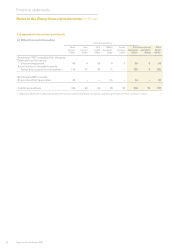
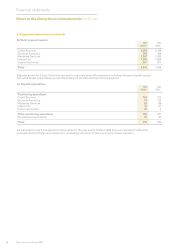
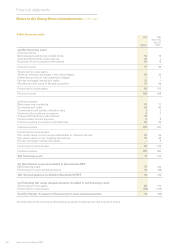
(b) Balance sheet at 31 March 2009
North Latin UK & EMEA/ Central To t a l
America America Ireland Asia Pacific Activities1 Group
US$m US$m US$m US$m US$m US$m
Goodwill 1,534 789 544 258 – 3,125
Investments in associates 313 – – 19 – 332
Other assets 1,012 567 432 299 143 2,453
Total segment assets 2,859 1,356 976 576 143 5,910
Total segment liabilities (444) (123) (268) (225) (221) (1,281)
Segment net assets/(liabilities) 2,415 1,233 708 351 (78) 4,629
Net present value of put option in respect of Serasa minority interest (424)
Net debt (2,110)
Tax (196)
Group net assets 1,899
1. Segment net assets for Central Activities represents corporate head ofce balances including retirement benet assets and obligations and derivative assets
and liabilities.