Experian 2009 Annual Report Download - page 7
Download and view the complete annual report
Please find page 7 of the 2009 Experian annual report below. You can navigate through the pages in the report by either clicking on the pages listed below, or by using the keyword search tool below to find specific information within the annual report.-
 1
1 -
 2
2 -
 3
3 -
 4
4 -
 5
5 -
 6
6 -
 7
7 -
 8
8 -
 9
9 -
 10
10 -
 11
11 -
 12
12 -
 13
13 -
 14
14 -
 15
15 -
 16
16 -
 17
17 -
 18
18 -
19
-
20
-
21
-
22
-
23
-
24
-
25
-
26
-
27
-
28
-
29
-
30
-
31
-
32
-
33
-
34
-
35
-
36
-
37
-
38
-
39
-
40
-
41
-
42
-
43
-
44
-
45
-
46
-
47
-
48
-
49
-
50
-
51
-
52
-
53
-
54
-
55
-
56
-
57
-
58
-
59
-
60
-
61
-
62
-
63
-
64
-
65
-
66
-
67
-
68
-
69
-
70
-
71
-
72
-
73
-
74
-
75
-
76
-
77
-
78
-
79
-
80
-
81
-
82
-
83
-
84
-
85
-
86
-
87
-
88
-
89
-
90
-
91
-
92
-
93
-
94
-
95
-
96
-
97
-
98
-
99
-
100
-
101
-
102
-
103
-
104
-
105
-
106
-
107
-
108
-
109
-
110
-
111
-
112
-
113
-
114
-
115
-
116
-
117
-
118
-
119
-
120
-
121
-
122
-
123
-
124
-
125
-
126
-
127
-
128
-
129
-
130
-
131
-
132
-
133
-
134
-
135
-
136
-
137
-
138
-
139
-
140
-
141
-
142
-
143
-
144
-
145
-
146
-
147
-
148
-
149
-
150
-
151
-
152
 |
 |

5Experian Annual Report 2009
Introduction
Business and market overview
Governance
44 – 72
Financial statements
73 – 148
Business review
8 – 43
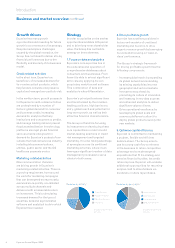
• Experian has over 100,000 clients
across the world, with no single
client accounting for more than
2% of group revenue. The top ten
clients account for 14% and the
top 50 for 29% of global revenue.
• Revenue by region in the year
ended 31 March 2009: 55%
of revenue came from North
America, 12% from Latin America,
22% from UK and Ireland and 11%
from EMEA/Asia Pacic.
• Revenue by activity in the year
ended 31 March 2009: 42% of
revenue came from Credit
Services, 13% from Decision
Analytics, 20% from Marketing
Services and 25% from
Interactive.
• Experian’s customer base is
diverse, with 41% of revenue
generated from nancial services
clients, 18% from direct-to-
consumer, 14% from retail, home
shopping and catalogue, 5%
from telecommunications and
utilities, 5% from government,
public sector and education, and
the balance from automotive,
insurance and media, publishing
and advertising.
• Globally, Experian has
approximately 450m consumer
credit records and approximately
35m business credit records.
• Experian employs approximately
15,000 people and has ofces in
40 countries.
Marketing Services
Marketing Services helps clients to nd
and retain customers, using the most
appropriate channel and message.
Experian gathers extensive geographic,
demographic and lifestyle information
on consumers and businesses. The
data is used in conjunction with
advanced analytical systems to enable
clients to prole their customers,
undertake highly targeted campaigns
and measure their marketing success
rates and return on investment.
Interactive
Interactive enables consumers to
manage and protect their personal
credit les and to make more informed
purchasing decisions. Experian
provides credit reports directly to
consumers, together with credit scores
and tools for preventing identity theft.
It also provides businesses with lead
generation by connecting them with
consumers over the internet.
Key facts
In the US, large marketing
competitors for traditional direct
marketing services include Acxiom
and Harte-Hanks. Competition
elsewhere tends to be fragmented
and specialist, particularly in new
media.
Experian’s direct-to-consumer,
credit information business is the
clear market leader in both the US
and UK. In the US, competition is
provided by Equifax, TransUnion, Fair
Isaac and other smaller specialists,
but Experian is more than twice the
size of any of these competitors. In
the UK, competition is provided by
Equifax and smaller niche players.
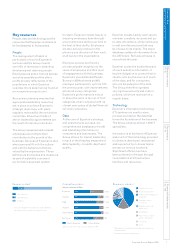
Marketing Services
Revenue by region
Contribution to Group revenue
UK and Ireland 36%North America 46%
Latin America 2% EMEA/Asia Pacic 16%
20%20%
20%
Interactive
Revenue by region
Contribution to Group revenue
North America 91%
UK and Ireland 9%
21%21%
25%