Experian 2009 Annual Report Download - page 5
Download and view the complete annual report
Please find page 5 of the 2009 Experian annual report below. You can navigate through the pages in the report by either clicking on the pages listed below, or by using the keyword search tool below to find specific information within the annual report.-
 1
1 -
 2
2 -
 3
3 -
 4
4 -
 5
5 -
 6
6 -
 7
7 -
 8
8 -
 9
9 -
 10
10 -
 11
11 -
 12
12 -
 13
13 -
 14
14 -
 15
15 -
 16
16 -
17
-
18
-
19
-
20
-
21
-
22
-
23
-
24
-
25
-
26
-
27
-
28
-
29
-
30
-
31
-
32
-
33
-
34
-
35
-
36
-
37
-
38
-
39
-
40
-
41
-
42
-
43
-
44
-
45
-
46
-
47
-
48
-
49
-
50
-
51
-
52
-
53
-
54
-
55
-
56
-
57
-
58
-
59
-
60
-
61
-
62
-
63
-
64
-
65
-
66
-
67
-
68
-
69
-
70
-
71
-
72
-
73
-
74
-
75
-
76
-
77
-
78
-
79
-
80
-
81
-
82
-
83
-
84
-
85
-
86
-
87
-
88
-
89
-
90
-
91
-
92
-
93
-
94
-
95
-
96
-
97
-
98
-
99
-
100
-
101
-
102
-
103
-
104
-
105
-
106
-
107
-
108
-
109
-
110
-
111
-
112
-
113
-
114
-
115
-
116
-
117
-
118
-
119
-
120
-
121
-
122
-
123
-
124
-
125
-
126
-
127
-
128
-
129
-
130
-
131
-
132
-
133
-
134
-
135
-
136
-
137
-
138
-
139
-
140
-
141
-
142
-
143
-
144
-
145
-
146
-
147
-
148
-
149
-
150
-
151
-
152
 |
 |

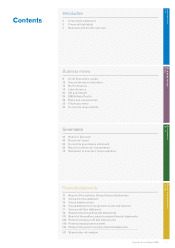
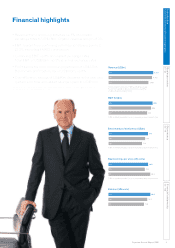
3Experian Annual Report 2009
Introduction
Chairman’s statement/Financial highlights
Governance
44 – 72
Financial statements
73 – 148
Business review
8 – 43
Financial highlights
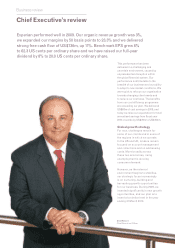
•Revenuefromcontinuingactivitiesup8%atconstant
exchangeratestoUS$3.8bn.Organicrevenuegrowthof3%.
•EBITmarginfromcontinuingactivitiesup50basispointsto
23.3%,excludingFAREScontribution.
•ContinuingEBITup8%atconstantexchangerates.
TotalEBITofUS$939m,up3%atactualexchangerates.
•ProtbeforetaxfromcontinuingoperationsofUS$578m.
BenchmarkprotbeforetaxofUS$843m,up8%.
•CostefciencysavingsofUS$80mdeliveredintheyearand
guidancefortotalannualisedsavingsraisedtoUS$150m.
Seethenancialreviewonpage37andnote2totheGroupnancialstatementsonpage90fordenitionsof
non-GAAPmeasuresusedthroughoutthisreport.
Dividend (US cents)
09
07
08
20.0
18.5
17.0
09 939
07 825
08 908
EBIT (US$m)
FY08 restated to exclude French transaction processing activities
09 3,821
07 3,407
08 3,712
Revenue (US$m)
Continuing activities only. FY08 restated to exclude
French transaction processing activities and other
smaller discontinuing activities
09
07
08
843
783
714
Benchmark prot before tax (US$m)
FY08 restated to exclude French transaction processing activities
09
07
08
48.0
43.3
49.9
Basic earnings per share (US cents)
FY08 restated to exclude French transaction processing activities