Experian 2009 Annual Report Download - page 129
Download and view the complete annual report
Please find page 129 of the 2009 Experian annual report below. You can navigate through the pages in the report by either clicking on the pages listed below, or by using the keyword search tool below to find specific information within the annual report.-
 1
1 -
2
-
3
-
4
-
5
-
6
-
7
-
8
-
9
-
10
-
11
-
12
-
13
-
14
-
15
-
16
-
17
-
18
-
19
-
20
-
21
-
22
-
23
-
24
-
25
-
26
-
27
-
28
-
29
-
30
-
31
-
32
-
33
-
34
-
35
-
36
-
37
-
38
-
39
-
40
-
41
-
42
-
43
-
44
-
45
-
46
-
47
-
48
-
49
-
50
-
51
-
52
-
53
-
54
-
55
-
56
-
57
-
58
-
59
-
60
-
61
-
62
-
63
-
64
-
65
-
66
-
67
-
68
-
69
-
70
-
71
-
72
-
73
-
74
-
75
-
76
-
77
-
78
-
79
-
80
-
81
-
82
-
83
-
84
-
85
-
86
-
87
-
88
-
89
-
90
-
91
-
92
-
93
-
94
-
95
-
96
-
97
-
98
-
99
-
100
-
101
-
102
-
103
-
104
-
105
-
106
-
107
-
108
-
109
-
110
-
111
-
112
-
113
-
114
-
115
-
116
-
117
-
118
-
 119
119 -
 120
120 -
 121
121 -
 122
122 -
 123
123 -
 124
124 -
 125
125 -
 126
126 -
 127
127 -
 128
128 -
 129
129 -
 130
130 -
 131
131 -
 132
132 -
 133
133 -
 134
134 -
 135
135 -
 136
136 -
 137
137 -
 138
138 -
 139
139 -
140
-
141
-
142
-
143
-
144
-
145
-
146
-
147
-
148
-
149
-
150
-
151
-
152
 |
 |

127Experian Annual Report 2009
Introduction
2 – 7
Business review
8 – 43
Governance
44 – 72
Financial statements
Group nancial statements
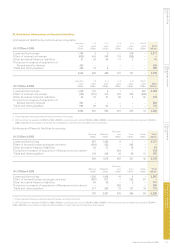
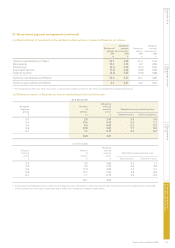
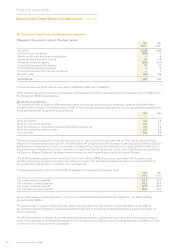
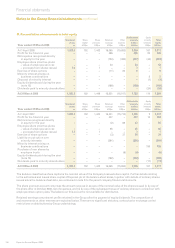
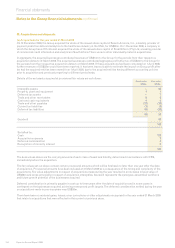
28. Retirement benet assets/obligations (continued)
Assets of the Group’s dened benet plans and their expected
long-term rates of return
Fair value Return Fair value Return
2009 2009 2008 2008
US$m % p.a. US$m % p.a.
Equities 345 8.7 693 9.1
Fixed interest securities 214 6.0 343 5.7
Other 36 6.5 9 5.1
595 7.5 1,045 8.0
The overall return has been determined by considering the mix of returns anticipated on the assets held in accordance with
the current investment policy. Expected yields on xed interest securities are based on gross redemption yields as at the
balance sheet date. Expected returns on equities and other assets reect the long-term real rates of return experienced in the
respective markets.
History of experience gains and losses
2009 2008 2007 2006 2005
US$m US$m US$m US$m US$m
Present value of dened benet obligations (653) (913) (984) (1,989) (2,025)
Fair value of plans’ assets 595 1,045 1,069 2,020 1,814
Net pension (obligations)/assets (58) 132 85 31 (211)
Experience adjustment arising on dened benet obligations:
Losses/(gains) 1 8 (5) 2 (110)
Experience adjustment arising on plans’ assets:
Losses/(gains) 236 101 53 (241) –
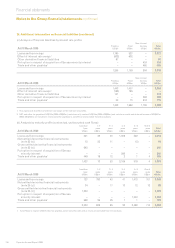
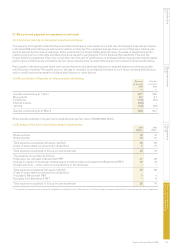
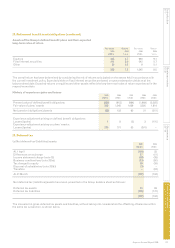
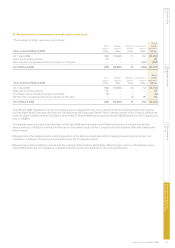
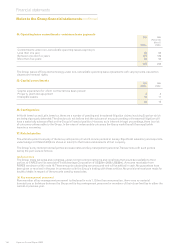
29. Deferred tax
(a) Net deferred tax (liabilities)/assets
2009 2008
US$m US$m
At 1 April (144) 35
Differences on exchange 37 (11)
Income statement charge (note 10) (58) (38)
Business combinations (note 33(a)) (13) (90)
Tax charged to equity 59 (16)
Disposal of subsidiaries (note 33(b)) (3) –
Tr a n s f e r s – (24)
At 31 March (122) (144)
Net deferred tax (liabilities)/assets have been presented in the Group balance sheet as follows:
Deferred tax assets 13 26
Deferred tax liabilities (135) (170)
(122) (144)
The movement in gross deferred tax assets and liabilities, without taking into consideration the offsetting of balances within
the same tax jurisdiction, is shown below.