Experian 2009 Annual Report Download - page 108
Download and view the complete annual report
Please find page 108 of the 2009 Experian annual report below. You can navigate through the pages in the report by either clicking on the pages listed below, or by using the keyword search tool below to find specific information within the annual report.-
 1
1 -
2
-
3
-
4
-
5
-
6
-
7
-
8
-
9
-
10
-
11
-
12
-
13
-
14
-
15
-
16
-
17
-
18
-
19
-
20
-
21
-
22
-
23
-
24
-
25
-
26
-
27
-
28
-
29
-
30
-
31
-
32
-
33
-
34
-
35
-
36
-
37
-
38
-
39
-
40
-
41
-
42
-
43
-
44
-
45
-
46
-
47
-
48
-
49
-
50
-
51
-
52
-
53
-
54
-
55
-
56
-
57
-
58
-
59
-
60
-
61
-
62
-
63
-
64
-
65
-
66
-
67
-
68
-
69
-
70
-
71
-
72
-
73
-
74
-
75
-
76
-
77
-
78
-
79
-
80
-
81
-
82
-
83
-
84
-
85
-
86
-
87
-
88
-
89
-
90
-
91
-
92
-
93
-
94
-
95
-
96
-
97
-
 98
98 -
 99
99 -
 100
100 -
 101
101 -
 102
102 -
 103
103 -
 104
104 -
 105
105 -
 106
106 -
 107
107 -
 108
108 -
 109
109 -
 110
110 -
 111
111 -
 112
112 -
 113
113 -
 114
114 -
 115
115 -
 116
116 -
 117
117 -
 118
118 -
119
-
120
-
121
-
122
-
123
-
124
-
125
-
126
-
127
-
128
-
129
-
130
-
131
-
132
-
133
-
134
-
135
-
136
-
137
-
138
-
139
-
140
-
141
-
142
-
143
-
144
-
145
-
146
-
147
-
148
-
149
-
150
-
151
-
152
 |
 |

106 Experian Annual Report 2009
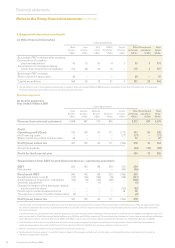
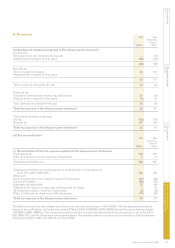
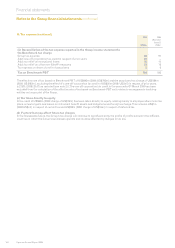
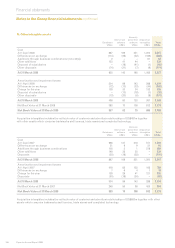
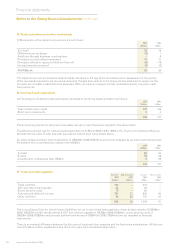
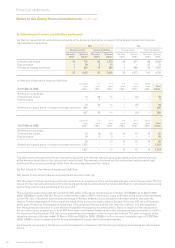
12. Basic and diluted earnings per share
Basic earnings per share is calculated by dividing the earnings attributable to ordinary shareholders of the Company
by a weighted average number of ordinary shares in issue during the year (excluding own shares held in employee trusts,
which are treated as cancelled).
The calculation of diluted earnings per share reects the potential dilutive effect of employee share incentive plans.
The earnings gures used in the calculations are unchanged for diluted earnings per share.
2009 2008
(Restated)
(Note 2)
Basic earnings per share: US cents US cents
Continuing and discontinued operations 48.0 43.3
Exclude: discontinued operations (1.2) (2.2)
Continuing operations 46.8 41.1
Add back of exceptional and other non-GAAP measures, net of tax 15.5 16.4
Benchmark earnings per share from continuing operations (non-GAAP measure) 62.3 57.5
2009 2008
(Restated)
(Note 2)
Diluted earnings per share: US cents US cents
Continuing and discontinued operations 47.5 42.7
Exclude: discontinued operations (1.2) (2.1)
Continuing operations 46.3 40.6
Add back of exceptional and other non-GAAP measures, net of tax 15.3 16.2
Benchmark diluted earnings per share from continuing operations (non-GAAP measure) 61.6 56.8
2009 2008
(Restated)
(Note 2)
Earnings: US$m US$m
Continuing and discontinued operations 486 437
Exclude: discontinued operations (12) (22)
Continuing operations 474 415
Add back of exceptional and other non-GAAP measures, net of tax 157 166
Benchmark earnings (non-GAAP measure) 631 581
2009 2008
Earnings attributable to minority interests: US$m US$m
Continuing and discontinued operations 20 15
Add back of amortisation of acquisition intangibles attributable to the minority, net of tax 8 6
Benchmark earnings attributable to minority interests (non-GAAP measure) 28 21
2009 2008
Weighted average number of ordinary shares in issue: m m
Weighted average number of ordinary shares in issue during the year 1,012.6 1,008.9
Dilutive effect of share incentive awards 12.3 13.4
Diluted weighted average number of ordinary shares in issue during the year 1,024.9 1,022.3
Notes to the Group nancial statements continued
Financial statements