Experian 2009 Annual Report Download - page 76
Download and view the complete annual report
Please find page 76 of the 2009 Experian annual report below. You can navigate through the pages in the report by either clicking on the pages listed below, or by using the keyword search tool below to find specific information within the annual report.-
 1
1 -
2
-
3
-
4
-
5
-
6
-
7
-
8
-
9
-
10
-
11
-
12
-
13
-
14
-
15
-
16
-
17
-
18
-
19
-
20
-
21
-
22
-
23
-
24
-
25
-
26
-
27
-
28
-
29
-
30
-
31
-
32
-
33
-
34
-
35
-
36
-
37
-
38
-
39
-
40
-
41
-
42
-
43
-
44
-
45
-
46
-
47
-
48
-
49
-
50
-
51
-
52
-
53
-
54
-
55
-
56
-
57
-
58
-
59
-
60
-
61
-
62
-
63
-
64
-
65
-
 66
66 -
 67
67 -
 68
68 -
 69
69 -
 70
70 -
 71
71 -
 72
72 -
 73
73 -
 74
74 -
 75
75 -
 76
76 -
 77
77 -
 78
78 -
 79
79 -
 80
80 -
 81
81 -
 82
82 -
 83
83 -
 84
84 -
 85
85 -
 86
86 -
87
-
88
-
89
-
90
-
91
-
92
-
93
-
94
-
95
-
96
-
97
-
98
-
99
-
100
-
101
-
102
-
103
-
104
-
105
-
106
-
107
-
108
-
109
-
110
-
111
-
112
-
113
-
114
-
115
-
116
-
117
-
118
-
119
-
120
-
121
-
122
-
123
-
124
-
125
-
126
-
127
-
128
-
129
-
130
-
131
-
132
-
133
-
134
-
135
-
136
-
137
-
138
-
139
-
140
-
141
-
142
-
143
-
144
-
145
-
146
-
147
-
148
-
149
-
150
-
151
-
152
 |
 |

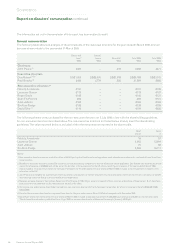
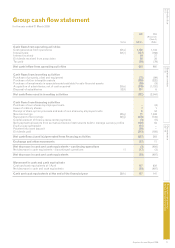
74 Experian Annual Report 2009
Financial statements
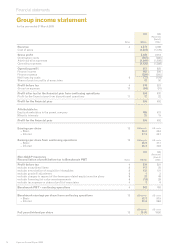
Group income statement
for the year ended 31 March 2009
2009 2008
(Restated)
(Note 2)
Notes US$m US$m
Revenue 4 3,873 3,789
Cost of sales (1,824) (1,776)
Gross prot 2,049 2,013
Distribution costs (387) (380)
Administrative expenses (1,049) (1,008)
Operating expenses (1,436) (1,388)
Operating prot 613 625
Finance income 182 206
Finance expense (259) (360)
Net nancing costs 9 (77) (154)
Share of post-tax prots of associates 42 50
Prot before tax 4 578 521
Group tax expense 10 (84) (91)
Prot after tax for the nancial year from continuing operations 494 430
Prot for the nancial year from discontinued operations 11 12 22
Prot for the nancial year 506 452
Attributable to:
Equity shareholders in the parent company 486 437
Minority interests 20 15
Prot for the nancial year 506 452
Earnings per share 12 US cents US cents
– Basic 48.0 43.3
– Diluted 47.5 42.7
Earnings per share from continuing operations 12 US cents US cents
– Basic 46.8 41.1
– Diluted 46.3 40.6
2009 2008
(Restated)
Non-GAAP measures
(Note 2)
Reconciliation of prot before tax to Benchmark PBT Notes US$m US$m
Prot before tax 4 578 521
exclude: exceptional items 8 117 55
exclude: amortisation of acquisition intangibles 8 132 121
exclude: goodwill adjustment 8 1 2
exclude: charges in respect of the demerger-related equity incentive plans 8 32 49
exclude: nancing fair value remeasurements 8 (19) 29
exclude: tax expense on share of prot of associates 4 2 6
Benchmark PBT – continuing operations 4 843 783
Benchmark earnings per share from continuing operations 12 US cents US cents
– Basic 62.3 57.5
– Diluted 61.6 56.8
US cents US cents
Full year dividend per share 13 20.00 18.50