Experian 2009 Annual Report Download - page 116
Download and view the complete annual report
Please find page 116 of the 2009 Experian annual report below. You can navigate through the pages in the report by either clicking on the pages listed below, or by using the keyword search tool below to find specific information within the annual report.-
 1
1 -
2
-
3
-
4
-
5
-
6
-
7
-
8
-
9
-
10
-
11
-
12
-
13
-
14
-
15
-
16
-
17
-
18
-
19
-
20
-
21
-
22
-
23
-
24
-
25
-
26
-
27
-
28
-
29
-
30
-
31
-
32
-
33
-
34
-
35
-
36
-
37
-
38
-
39
-
40
-
41
-
42
-
43
-
44
-
45
-
46
-
47
-
48
-
49
-
50
-
51
-
52
-
53
-
54
-
55
-
56
-
57
-
58
-
59
-
60
-
61
-
62
-
63
-
64
-
65
-
66
-
67
-
68
-
69
-
70
-
71
-
72
-
73
-
74
-
75
-
76
-
77
-
78
-
79
-
80
-
81
-
82
-
83
-
84
-
85
-
86
-
87
-
88
-
89
-
90
-
91
-
92
-
93
-
94
-
95
-
96
-
97
-
98
-
99
-
100
-
101
-
102
-
103
-
104
-
105
-
 106
106 -
 107
107 -
 108
108 -
 109
109 -
 110
110 -
 111
111 -
 112
112 -
 113
113 -
 114
114 -
 115
115 -
 116
116 -
 117
117 -
 118
118 -
 119
119 -
 120
120 -
 121
121 -
 122
122 -
 123
123 -
 124
124 -
 125
125 -
 126
126 -
127
-
128
-
129
-
130
-
131
-
132
-
133
-
134
-
135
-
136
-
137
-
138
-
139
-
140
-
141
-
142
-
143
-
144
-
145
-
146
-
147
-
148
-
149
-
150
-
151
-
152
 |
 |

114 Experian Annual Report 2009
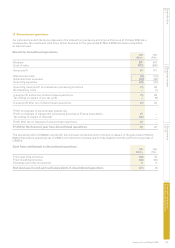
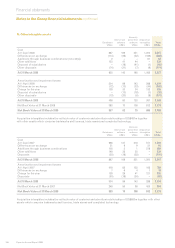
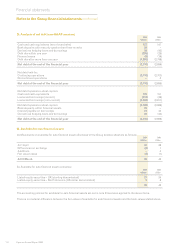
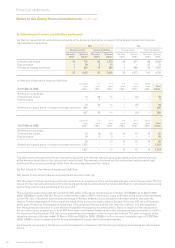
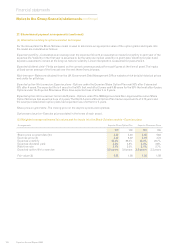
23. Analysis of net debt (non-GAAP measure)
2009 2008
US$m US$m
Cash and cash equivalents (net of overdrafts) 127 147
Bank deposits with maturity greater than three months 29 –
Derivatives hedging loans and borrowings 28 (43)
Debt due within one year (295) (29)
Finance leases (9) (16)
Debt due after more than one year (1,990) (2,758)
Net debt at the end of the nancial year (2,110) (2,699)
Net debt held by:
Continuing operations (2,110) (2,701)
Discontinued operations – 2
Net debt at the end of the nancial year (2,110) (2,699)
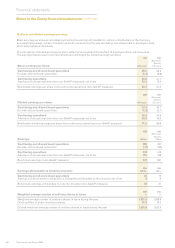
Net debt by balance sheet caption:
Cash and cash equivalents 129 151
Loans and borrowings (current) (314) (39)
Loans and borrowings (non-current) (2,003) (2,811)
Net debt by balance sheet caption (2,188) (2,699)
Bank deposits within nancial assets 29 –
Interest payable on borrowings 21 43
Derivatives hedging loans and borrowings 28 (43)
Net debt at the end of the nancial year (2,110) (2,699)
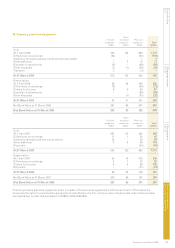
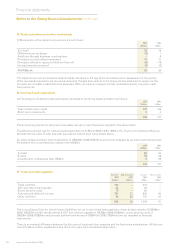
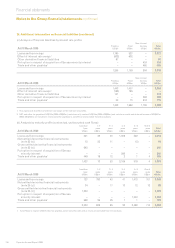
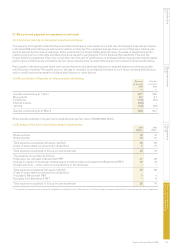
24. Available for sale nancial assets
(a) Movements on available for sale nancial assets disclosed in the Group balance sheet are as follows:
2009 2008
US$m US$m
At 1 April 42 38
Differences on exchange (8) 1
Additions – 4
Fair value losses (8) (1)
At 31 March 26 42
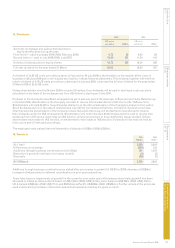
(b) Available for sale nancial assets comprise:
2009 2008
US$m US$m
Listed equity securities – UK (sterling denominated) 21 34
Listed equity securities – North America (US dollar denominated) 5 8
26 42
The accounting policies for available for sale nancial assets set out in note 2 have been applied to the above items.
There is no material difference between the fair values of available for sale nancial assets and the book values stated above.
Notes to the Group nancial statements continued
Financial statements