Experian 2009 Annual Report Download - page 14
Download and view the complete annual report
Please find page 14 of the 2009 Experian annual report below. You can navigate through the pages in the report by either clicking on the pages listed below, or by using the keyword search tool below to find specific information within the annual report.-
 1
1 -
2
-
3
-
 4
4 -
 5
5 -
 6
6 -
 7
7 -
 8
8 -
 9
9 -
 10
10 -
 11
11 -
 12
12 -
 13
13 -
 14
14 -
 15
15 -
 16
16 -
 17
17 -
 18
18 -
 19
19 -
 20
20 -
 21
21 -
 22
22 -
 23
23 -
 24
24 -
25
-
26
-
27
-
28
-
29
-
30
-
31
-
32
-
33
-
34
-
35
-
36
-
37
-
38
-
39
-
40
-
41
-
42
-
43
-
44
-
45
-
46
-
47
-
48
-
49
-
50
-
51
-
52
-
53
-
54
-
55
-
56
-
57
-
58
-
59
-
60
-
61
-
62
-
63
-
64
-
65
-
66
-
67
-
68
-
69
-
70
-
71
-
72
-
73
-
74
-
75
-
76
-
77
-
78
-
79
-
80
-
81
-
82
-
83
-
84
-
85
-
86
-
87
-
88
-
89
-
90
-
91
-
92
-
93
-
94
-
95
-
96
-
97
-
98
-
99
-
100
-
101
-
102
-
103
-
104
-
105
-
106
-
107
-
108
-
109
-
110
-
111
-
112
-
113
-
114
-
115
-
116
-
117
-
118
-
119
-
120
-
121
-
122
-
123
-
124
-
125
-
126
-
127
-
128
-
129
-
130
-
131
-
132
-
133
-
134
-
135
-
136
-
137
-
138
-
139
-
140
-
141
-
142
-
143
-
144
-
145
-
146
-
147
-
148
-
149
-
150
-
151
-
152
 |
 |

12 Experian Annual Report 2009
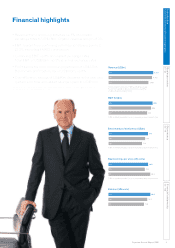
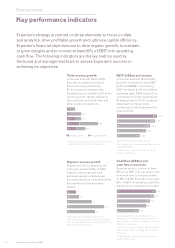
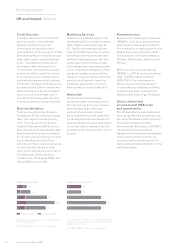
Key performance indicators
Business review
Experian’s strategy is centred on three elements: to focus on data
and analytics, drive protable growth and optimise capital efciency.
Experian’s nancial objectives are to drive organic growth, to maintain
or grow margins and to convert at least 85% of EBIT into operating
cash ow. The following indicators are the key metrics used by
the board and management team to assess Experian’s success in
achieving its objectives.
Organic revenue growth
Organic growth increased by 3%
in the year ended 31 March 2009.
Organic revenue growth was
achieved against a challenging
economic backdrop, demonstrating
the resilience of the business
model.
09
07
06
05
08 4%
8%
3%
12%
9%
Organic growth is dened as year-on-year
continuing revenue growth at constant exchange
rates, excluding acquisitions except afliates, until
the date of their anniversary
Cash ow (US$m) and
cash ow conversion
Experian aims to convert at least
85% of its EBIT into operating cash
ow each year. In the year ended
31 March 2009, Experian converted
99% of EBIT to operating cash ow,
signicantly in excess of its target.
09 927
07 804
06 717
05 535
08 886
99%
98%
97%
99%
94%
Operating cash ow is dened as EBIT less
changes in working capital, add depreciation/
amortisation, less capital expenditure, less prot
retained in associates
Cash ow conversion is operating cash ow as
a percentage of EBIT including discontinuing
activities
FY08 restated to exclude French transaction
processing activities
EBIT (US$m) and margin
In the year ended 31 March 2009,
Experian increased its total EBIT
by 3% to US$939m. Continuing
EBIT increased by 8% at constant
exchange rates. EBIT margin from
continuing activities expanded by
50 basis points to 23.3%. Experian
delivered this margin while
continuing to fund investment for
future growth.
Total revenue growth
In the year ended 31 March 2009,
Experian increased its revenue
from continuing activities by
8% at constant exchange rates.
Acquisitions accounted for 5% of the
revenue growth, largely reecting
the contributions from Serasa and
other smaller acquisitions.
09
07
06
05
08
Organic growth Acquired growth
Total growth is dened as year-on-year continuing
revenue growth at constant exchange rates
EBIT includes discontinuing activities
EBIT margin is for continuing direct business only,
excluding FARES
FY08 restated to exclude French transaction
processing activities
09 939
07 825
06 727
05 567
08 908
23.3%
8%
21.0%
21.9%
22.8%
14%
14%
30%
18%
20.0%