Experian 2009 Annual Report Download - page 114
Download and view the complete annual report
Please find page 114 of the 2009 Experian annual report below. You can navigate through the pages in the report by either clicking on the pages listed below, or by using the keyword search tool below to find specific information within the annual report.-
 1
1 -
2
-
3
-
4
-
5
-
6
-
7
-
8
-
9
-
10
-
11
-
12
-
13
-
14
-
15
-
16
-
17
-
18
-
19
-
20
-
21
-
22
-
23
-
24
-
25
-
26
-
27
-
28
-
29
-
30
-
31
-
32
-
33
-
34
-
35
-
36
-
37
-
38
-
39
-
40
-
41
-
42
-
43
-
44
-
45
-
46
-
47
-
48
-
49
-
50
-
51
-
52
-
53
-
54
-
55
-
56
-
57
-
58
-
59
-
60
-
61
-
62
-
63
-
64
-
65
-
66
-
67
-
68
-
69
-
70
-
71
-
72
-
73
-
74
-
75
-
76
-
77
-
78
-
79
-
80
-
81
-
82
-
83
-
84
-
85
-
86
-
87
-
88
-
89
-
90
-
91
-
92
-
93
-
94
-
95
-
96
-
97
-
98
-
99
-
100
-
101
-
102
-
103
-
 104
104 -
 105
105 -
 106
106 -
 107
107 -
 108
108 -
 109
109 -
 110
110 -
 111
111 -
 112
112 -
 113
113 -
 114
114 -
 115
115 -
 116
116 -
 117
117 -
 118
118 -
 119
119 -
 120
120 -
 121
121 -
 122
122 -
 123
123 -
 124
124 -
125
-
126
-
127
-
128
-
129
-
130
-
131
-
132
-
133
-
134
-
135
-
136
-
137
-
138
-
139
-
140
-
141
-
142
-
143
-
144
-
145
-
146
-
147
-
148
-
149
-
150
-
151
-
152
 |
 |

112 Experian Annual Report 2009
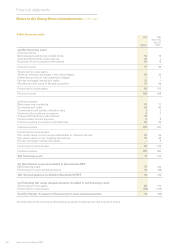
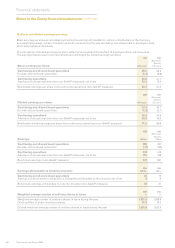
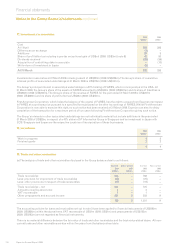
19. Trade and other receivables (continued)
(f) Movements on the impairment provision are as follows:
2009 2008
US$m US$m
At 1 April 24 14
Differences on exchange (3) 1
Additions through business combinations – 9
Provision for receivables impairment 13 17
Provision utilised in respect of debts written off (6) (14)
Unused amounts reversed (3) (3)
At 31 March 25 24
The impairment provision has been determined by reference to the age of the receivable and an assessment of the portion
of the receivable expected to be recovered. Amounts charged and credited to the Group income statement in respect of this
provision are included in administrative expenses. Other provisions in respect of trade receivables mainly comprise credit
note provisions.
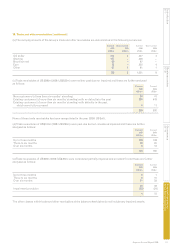
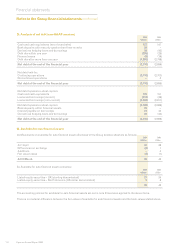
20. Cash and cash equivalents
(a) The analysis of cash and cash equivalents disclosed in the Group balance sheet is as follows:
2009 2008
US$m US$m
Cash at bank and in hand 127 148
Short-term investments 2 3
129 151
The accounting policies for loans and receivables set out in note 2 have been applied to the above items.
The effective interest rate for cash and cash equivalents at 31 March 2009 is 6.6% (2008: 4.1%). There is no material difference
between the fair value of cash and cash equivalents and the book value stated above.
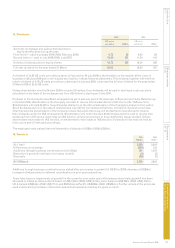
(b) Cash at bank and short-term investments of US$129m (2008: US$151m) are further analysed by external credit rating where
the balance with a counterparty is greater than US$2m:
2009 2008
US$m US$m
A rated 66 44
B rated 54 58
Counterparty holding less than US$2m 9 49
129 151
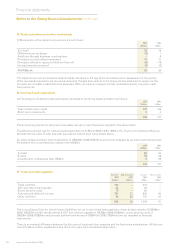
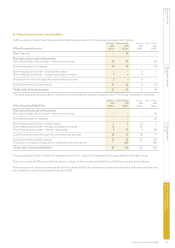
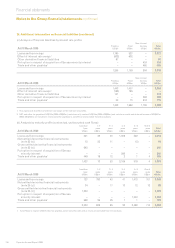
21. Trade and other payables
Current Non-current Current Non-current
2009 2009 2008 2008
US$m US$m US$m US$m
Trade creditors 104 – 214 –
VAT and other taxes payable 32 – 52 –
Social security costs 78 – 95 –
Accruals and deferred income 751 17 818 24
Other creditors 30 25 100 33
995 42 1,279 57
The accounting policies for other nancial liabilities set out in note 2 have been applied to nancial instruments of US$480m
(2008: US$578m) within the above items. VAT and other tax payable of US$32m (2008: US$52m), social security costs of
US$78m (2008: US$95m) and accruals and deferred income of US$447m (2008: US$474m) are not regarded as nancial
instruments.
There is no material difference between the fair value of trade and other payables and the book value stated above. All the non-
current trade and other payables are due within ve years from the balance sheet date.
Notes to the Group nancial statements continued
Financial statements