Experian 2009 Annual Report Download - page 24
Download and view the complete annual report
Please find page 24 of the 2009 Experian annual report below. You can navigate through the pages in the report by either clicking on the pages listed below, or by using the keyword search tool below to find specific information within the annual report.-
 1
1 -
2
-
3
-
4
-
5
-
6
-
7
-
8
-
9
-
10
-
11
-
12
-
13
-
 14
14 -
 15
15 -
 16
16 -
 17
17 -
 18
18 -
 19
19 -
 20
20 -
 21
21 -
 22
22 -
 23
23 -
 24
24 -
 25
25 -
 26
26 -
 27
27 -
 28
28 -
 29
29 -
 30
30 -
 31
31 -
 32
32 -
 33
33 -
 34
34 -
35
-
36
-
37
-
38
-
39
-
40
-
41
-
42
-
43
-
44
-
45
-
46
-
47
-
48
-
49
-
50
-
51
-
52
-
53
-
54
-
55
-
56
-
57
-
58
-
59
-
60
-
61
-
62
-
63
-
64
-
65
-
66
-
67
-
68
-
69
-
70
-
71
-
72
-
73
-
74
-
75
-
76
-
77
-
78
-
79
-
80
-
81
-
82
-
83
-
84
-
85
-
86
-
87
-
88
-
89
-
90
-
91
-
92
-
93
-
94
-
95
-
96
-
97
-
98
-
99
-
100
-
101
-
102
-
103
-
104
-
105
-
106
-
107
-
108
-
109
-
110
-
111
-
112
-
113
-
114
-
115
-
116
-
117
-
118
-
119
-
120
-
121
-
122
-
123
-
124
-
125
-
126
-
127
-
128
-
129
-
130
-
131
-
132
-
133
-
134
-
135
-
136
-
137
-
138
-
139
-
140
-
141
-
142
-
143
-
144
-
145
-
146
-
147
-
148
-
149
-
150
-
151
-
152
 |
 |

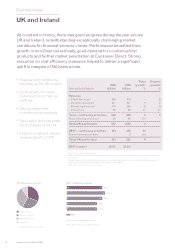
22 Experian Annual Report 2009
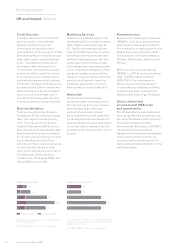
UK and Ireland continued
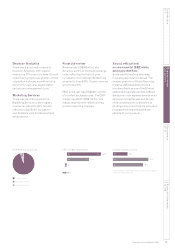
Credit Services
The major disruption in the nancial
services industry during the year
caused a signicant reduction
in lending as well as major client
consolidations. Total revenue for Credit
Services was at at constant exchange
rates, while organic revenue declined
by 2%. The relatively modest rate of
decline was reective of growth in
non-nancial verticals such as public
sector and utilities, growth in revenue
from countercyclical initiatives and a
resilient performance within business
information. Strategic initiatives during
the year included further investment in
sales infrastructure across the public
sector and utilities verticals, and re-
orientation of existing sales resource
towards countercyclical opportunities.
Decision Analytics
Total revenue at Decision Analytics
increased by 9% at constant exchange
rates, with organic revenue growth
of 6%. The acquisition contribution
related to Tallyman and N4 Solutions,
both of which performed ahead of plan.
Growth was driven by strong demand
for countercyclical products, including
fraud prevention and collections
software, and there was good progress
in non-nancial verticals such as
telecommunications and public sector.
During the year, there were large
contract wins with Anglian Water and
Vanquis Bank, for example.
Marketing Services
Total revenue in Marketing Services
decreased by 2% at constant exchange
rates. Organic revenue declined by
3%. Traditional marketing activities
were further affected by the downturn
in the nancial services market. New
media activities performed well, with
double-digit growth across contact
data management, email services and
online competitive intelligence. There
was good strategic progress during
the year across new media, with further
penetration of the public sector by
the Mosaic segmentation tool and
enhancements to contact data tools.
Interactive
Interactive performed strongly,
delivering organic revenue growth of
47%. Growth was driven by increased
direct memberships, reecting
product enhancements, greater
market segmentation and investment
in branding and customer acquisition.
Experian has also made good progress
in growing indirect memberships with
a number of afnity partnership wins in
the year.
Financial review
Revenue from continuing activities was
US$850m, up 5% at constant exchange
rates. Organic revenue growth was 3%.
The contribution to revenue growth from
acquisitions during the period was 2%.
The acquisition contribution related to
Tallyman, N4 Solutions, pH Group and
Hitwise.
EBIT from continuing activities was
US$213m, up 10% at constant exchange
rates. The EBIT margin was 25.1%
(2008: 23.6%). The improvement in
margin was due to strong execution
on cost efciency initiatives, including
outsourcing to India, organisational
delayering and technology efciencies.
Social, ethical and
environmental (SEE) risks
and opportunities
The UK and Ireland’s performance has
been recognised with two awards from
the charity ‘Business in the Community’.
The region has again achieved
environmental certication to ISO14001,
the most stringent international
measure of environmental management.
Investment in products with strong
social and environmental aspects will
make a demonstrable contribution in the
new nancial year.
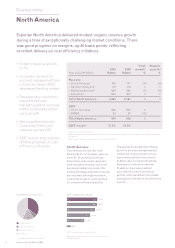
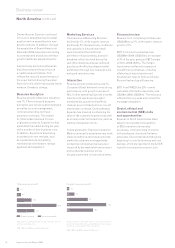
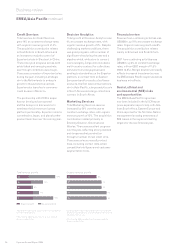
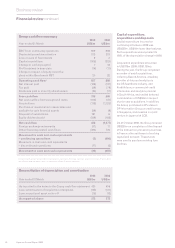
Organic revenue growth
7%
7%
3%
8%
3%09
08
07
06
05
Organic growth is dened as year-on-year revenue growth
at constant exchange rates, excluding acquisitions until the
date of their anniversary
2006, 2007 and 2008 exclude UK account processing
Organic growth Acquired growth
Total revenue growth
17%
Total growth is dened as year-on-year revenue growth at
constant exchange rates
2006, 2007 and 2008 exclude UK account processing
8%
22%
16%
5%
09
08
07
06
05
Business review