Experian 2009 Annual Report Download - page 109
Download and view the complete annual report
Please find page 109 of the 2009 Experian annual report below. You can navigate through the pages in the report by either clicking on the pages listed below, or by using the keyword search tool below to find specific information within the annual report.-
 1
1 -
2
-
3
-
4
-
5
-
6
-
7
-
8
-
9
-
10
-
11
-
12
-
13
-
14
-
15
-
16
-
17
-
18
-
19
-
20
-
21
-
22
-
23
-
24
-
25
-
26
-
27
-
28
-
29
-
30
-
31
-
32
-
33
-
34
-
35
-
36
-
37
-
38
-
39
-
40
-
41
-
42
-
43
-
44
-
45
-
46
-
47
-
48
-
49
-
50
-
51
-
52
-
53
-
54
-
55
-
56
-
57
-
58
-
59
-
60
-
61
-
62
-
63
-
64
-
65
-
66
-
67
-
68
-
69
-
70
-
71
-
72
-
73
-
74
-
75
-
76
-
77
-
78
-
79
-
80
-
81
-
82
-
83
-
84
-
85
-
86
-
87
-
88
-
89
-
90
-
91
-
92
-
93
-
94
-
95
-
96
-
97
-
98
-
 99
99 -
 100
100 -
 101
101 -
 102
102 -
 103
103 -
 104
104 -
 105
105 -
 106
106 -
 107
107 -
 108
108 -
 109
109 -
 110
110 -
 111
111 -
 112
112 -
 113
113 -
 114
114 -
 115
115 -
 116
116 -
 117
117 -
 118
118 -
 119
119 -
120
-
121
-
122
-
123
-
124
-
125
-
126
-
127
-
128
-
129
-
130
-
131
-
132
-
133
-
134
-
135
-
136
-
137
-
138
-
139
-
140
-
141
-
142
-
143
-
144
-
145
-
146
-
147
-
148
-
149
-
150
-
151
-
152
 |
 |

107Experian Annual Report 2009
Introduction
2 – 7
Business review
8 – 43
Governance
44 – 72
Financial statements
Group nancial statements
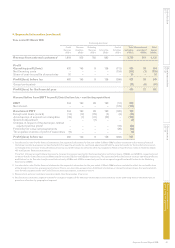
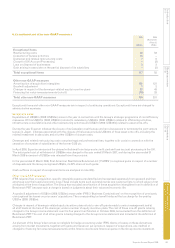
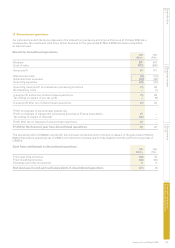
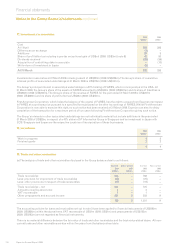
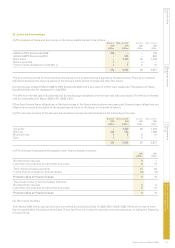
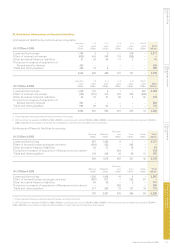
13. Dividends
2009 2008
US cents US cents
per share US$m per share US$m
Amounts recognised and paid as distributions to
equity shareholders during the year:
First interim – paid in January 2009 (2008: February 2008) 6.75 68 6.50 66
Second interim – paid in July 2008 (2008: July 2007) 12.00 121 11.50 116
Ordinary dividends paid on equity shares 18.75 189 18.00 182
Full year dividend for the year ended 31 March 20.00 18.50 187
A dividend of 13.25 US cents per ordinary share will be paid on 24 July 2009 to shareholders on the register at the close of
business on 26 June 2009 and is not included as a liability in these nancial statements. This dividend, together with the rst
interim dividend of 6.75 US cents per ordinary share paid in January 2009, comprises the full year dividend for the year ended
31 March 2009 of 20.00 US cents.
Unless shareholders elect by 26 June 2009 to receive US dollars, their dividends will be paid in sterling at a rate per share
calculated on the basis of the exchange rate from US dollars to sterling on 3 July 2009.
Pursuant to the Income Access Share arrangements put in place as part of the demerger of Experian and Home Retail Group
in October 2006, shareholders in the Company can elect to receive their dividends from a UK source (the ‘IAS election’).
Shareholders who held 50,000 or fewer Experian shares (i) on the date of admission of the Company’s shares to the London
Stock Exchange and (ii) in the case of shareholders who did not own shares at that time, on the rst dividend record date
after they become shareholders in the Company, unless they elect otherwise, will be deemed to have elected to receive
their dividends under the IAS arrangements. Shareholders who hold more than 50,000 shares and who wish to receive their
dividends from a UK source must make an IAS election. All elections remain in force indenitely unless revoked. Unless
shareholders have made an IAS election, or are deemed to have made an IAS election, dividends will be received from an
Irish source and will be taxed accordingly.
The employee trusts waived their entitlements to dividends of US$2m (2008: US$2m).
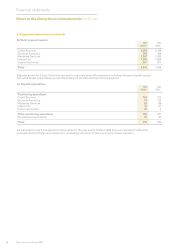
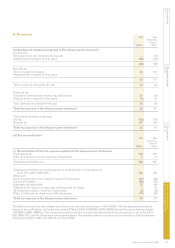
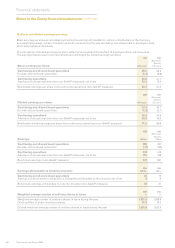
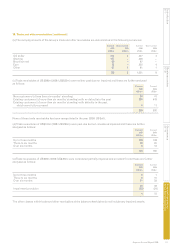
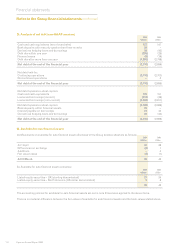
14. Goodwill
2009 2008
US$m US$m
At 1 April 3,605 2,219
Differences on exchange (521) 118
Additions through business combinations (note 33(a)) 101 1,272
Reduction in goodwill relating to tax losses (note 8) (1) (2)
Disposals (59) (2)
At 31 March 3,125 3,605
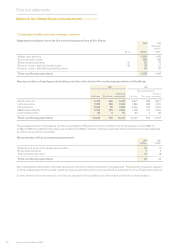
Additions through business combinations are stated after an increase in goodwill of US$11m (2008: decrease of US$9m)
in respect of adjustments to deferred consideration on prior year acquisitions.
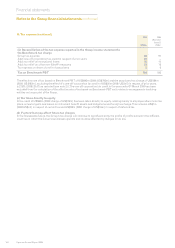
There have been no impairments of goodwill in the current or prior years and, at the balance sheet date, goodwill has been
allocated to CGUs as follows: North America US$1,534m (2008: US$1,474m), Latin America US$789m (2008: US$1,033m),
UK & Ireland US$544m (2008: US$711m) and EMEA/Asia Pacic US$258m (2008: US$387m). Further details of the principles
used in determining the basis of allocation and annual impairment testing are given in note 2.