Experian 2009 Annual Report Download - page 130
Download and view the complete annual report
Please find page 130 of the 2009 Experian annual report below. You can navigate through the pages in the report by either clicking on the pages listed below, or by using the keyword search tool below to find specific information within the annual report.-
 1
1 -
2
-
3
-
4
-
5
-
6
-
7
-
8
-
9
-
10
-
11
-
12
-
13
-
14
-
15
-
16
-
17
-
18
-
19
-
20
-
21
-
22
-
23
-
24
-
25
-
26
-
27
-
28
-
29
-
30
-
31
-
32
-
33
-
34
-
35
-
36
-
37
-
38
-
39
-
40
-
41
-
42
-
43
-
44
-
45
-
46
-
47
-
48
-
49
-
50
-
51
-
52
-
53
-
54
-
55
-
56
-
57
-
58
-
59
-
60
-
61
-
62
-
63
-
64
-
65
-
66
-
67
-
68
-
69
-
70
-
71
-
72
-
73
-
74
-
75
-
76
-
77
-
78
-
79
-
80
-
81
-
82
-
83
-
84
-
85
-
86
-
87
-
88
-
89
-
90
-
91
-
92
-
93
-
94
-
95
-
96
-
97
-
98
-
99
-
100
-
101
-
102
-
103
-
104
-
105
-
106
-
107
-
108
-
109
-
110
-
111
-
112
-
113
-
114
-
115
-
116
-
117
-
118
-
119
-
 120
120 -
 121
121 -
 122
122 -
 123
123 -
 124
124 -
 125
125 -
 126
126 -
 127
127 -
 128
128 -
 129
129 -
 130
130 -
 131
131 -
 132
132 -
 133
133 -
 134
134 -
 135
135 -
 136
136 -
 137
137 -
 138
138 -
 139
139 -
 140
140 -
141
-
142
-
143
-
144
-
145
-
146
-
147
-
148
-
149
-
150
-
151
-
152
 |
 |

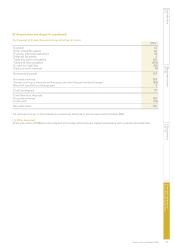
128 Experian Annual Report 2009
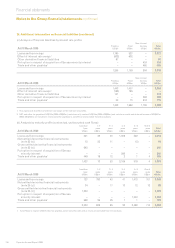
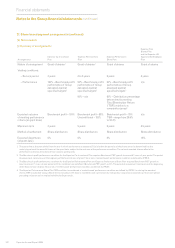
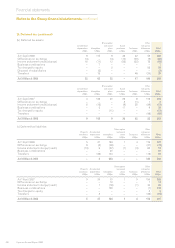
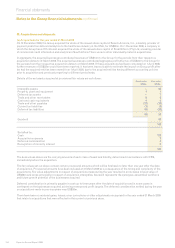
29. Deferred tax (continued)
(b) Deferred tax assets
Share option Other
Accelerated and award Asset temporary
depreciation Intangibles plans provisions Tax losses differences To t a l
US$m US$m US$m US$m US$m US$m US$m
At 1 April 2008 9 115 9 36 42 52 263
Differences on exchange (3) – (3) (14) (20) (2) (42)
Income statement credit/(charge) 16 (71) 13 (22) (53) 72 (45)
Business combinations – 7 – – – – 7
Tax charged to equity – – 3 – – 56 59
Disposal of subsidiaries – (3) – – – – (3)
Transfers – 15 – – 48 (34) 29
At 31 March 2009 22 63 22 – 17 144 268
Share option Other
Accelerated and award Asset temporary
depreciation Intangibles plans provisions Tax losses differences To t a l
US$m US$m US$m US$m US$m US$m US$m
At 1 April 2007 3 128 20 26 8 119 304
Differences on exchange – – – 2 (1) 1 2
Income statement credit/(charge) 6 (16) – (9) 35 (29) (13)
Business combinations – 3 – 17 – 9 29
Tax charged to equity – – (11) – – – (11)
Transfers – – – – – (48) (48)
At 31 March 2008 9 115 9 36 42 52 263
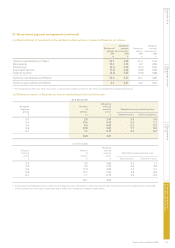
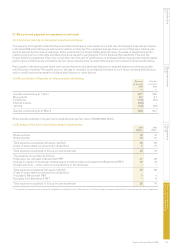
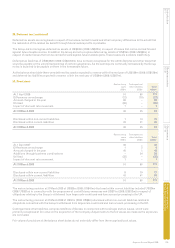
(c) Deferred tax liabilities
Share option Other
Property Accelerated and award temporary
valuations depreciation Intangibles plans Tax losses differences To t a l
US$m US$m US$m US$m US$m US$m US$m
At 1 April 2008 5 37 184 1 4 176 407
Differences on exchange 8 (2) (48) – – (37) (79)
Income statement charge/(credit) (13) 6 (57) (1) (4) 82 13
Business combinations – – 20 – – – 20
Transfers – (36) 144 – – (79) 29
At 31 March 2009 – 5 243 – – 142 390
Share option Other
Property Accelerated and award temporary
valuations depreciation Intangibles plans Tax losses differences To t a l
US$m US$m US$m US$m US$m US$m US$m
At 1 April 2007 5 34 70 1 5 154 269
Differences on exchange – – 12 – – 1 13
Income statement charge/(credit) – 1 (18) – (1) 43 25
Business combinations – – 120 – – (1) 119
Tax charged to equity – – – – – 5 5
Transfers – 2 – – – (26) (24)
At 31 March 2008 5 37 184 1 4 176 407
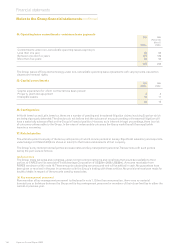
Notes to the Group nancial statements continued
Financial statements