Experian 2009 Annual Report Download - page 40
Download and view the complete annual report
Please find page 40 of the 2009 Experian annual report below. You can navigate through the pages in the report by either clicking on the pages listed below, or by using the keyword search tool below to find specific information within the annual report.-
 1
1 -
2
-
3
-
4
-
5
-
6
-
7
-
8
-
9
-
10
-
11
-
12
-
13
-
14
-
15
-
16
-
17
-
18
-
19
-
20
-
21
-
22
-
23
-
24
-
25
-
26
-
27
-
28
-
29
-
 30
30 -
 31
31 -
 32
32 -
 33
33 -
 34
34 -
 35
35 -
 36
36 -
 37
37 -
 38
38 -
 39
39 -
 40
40 -
 41
41 -
 42
42 -
 43
43 -
 44
44 -
 45
45 -
 46
46 -
 47
47 -
 48
48 -
 49
49 -
 50
50 -
51
-
52
-
53
-
54
-
55
-
56
-
57
-
58
-
59
-
60
-
61
-
62
-
63
-
64
-
65
-
66
-
67
-
68
-
69
-
70
-
71
-
72
-
73
-
74
-
75
-
76
-
77
-
78
-
79
-
80
-
81
-
82
-
83
-
84
-
85
-
86
-
87
-
88
-
89
-
90
-
91
-
92
-
93
-
94
-
95
-
96
-
97
-
98
-
99
-
100
-
101
-
102
-
103
-
104
-
105
-
106
-
107
-
108
-
109
-
110
-
111
-
112
-
113
-
114
-
115
-
116
-
117
-
118
-
119
-
120
-
121
-
122
-
123
-
124
-
125
-
126
-
127
-
128
-
129
-
130
-
131
-
132
-
133
-
134
-
135
-
136
-
137
-
138
-
139
-
140
-
141
-
142
-
143
-
144
-
145
-
146
-
147
-
148
-
149
-
150
-
151
-
152
 |
 |

38 Experian Annual Report 2009
Business review
Financial review continued
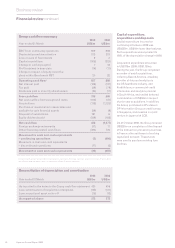
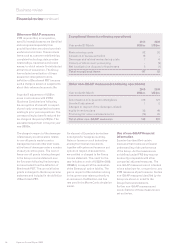
Reconciliation of revenue and EBIT by geography
2009 2008
Continuing Discontinuing Continuing Discontinuing
activities activities1 Total activities activities1 To t a l
Year ended 31 March US$m US$m US$m US$m US$m US$m
Revenue
North America 2,083 - 2,083 2,061 - 2,061
Latin America 462 - 462 324 - 324
UK and Ireland 850 52 902 959 65 1,024
EMEA/Asia Pacic 426 - 426 368 12 380
Total revenue 3,821 52 3,873 3,712 77 3,789
EBIT
North America – direct business 568 - 568 554 - 554
FARES 48 - 48 54 - 54
Total North America 616 - 616 608 - 608
Latin America 118 - 118 75 - 75
UK and Ireland 213 - 213 226 6 232
EMEA/Asia Pacic 49 - 49 50 - 50
Central Activities (57) - (57) (57) - (57)
Total EBIT 939 - 939 902 6 908
Reconciliation of EBIT to Operating prot
for continuing operations
2009 2008
Year ended 31 March US$m US$m
EBIT from continuing operations 939 908
Net interest (96) (125)
Benchmark PBT 843 783
Exceptional items (117) (55)
Amortisation of acquisition intangibles (132) (121)
Goodwill adjustment (1) (2)
Charges for demerger-related equity incentive plans (32) (49)
Financing fair value remeasurements 19 (29)
Tax expense on share of prot of associates (2) (6)
Prot before tax 578 521
Share of post-tax prots of associates (42) (50)
Net nancing costs 77 154
Operating prot 613 625
1 Discontinuing activities include UK account processing, Loyalty Solutions and other smaller discontinuing activities