Experian 2009 Annual Report Download - page 39
Download and view the complete annual report
Please find page 39 of the 2009 Experian annual report below. You can navigate through the pages in the report by either clicking on the pages listed below, or by using the keyword search tool below to find specific information within the annual report.-
 1
1 -
2
-
3
-
4
-
5
-
6
-
7
-
8
-
9
-
10
-
11
-
12
-
13
-
14
-
15
-
16
-
17
-
18
-
19
-
20
-
21
-
22
-
23
-
24
-
25
-
26
-
27
-
28
-
 29
29 -
 30
30 -
 31
31 -
 32
32 -
 33
33 -
 34
34 -
 35
35 -
 36
36 -
 37
37 -
 38
38 -
 39
39 -
 40
40 -
 41
41 -
 42
42 -
 43
43 -
 44
44 -
 45
45 -
 46
46 -
 47
47 -
 48
48 -
 49
49 -
50
-
51
-
52
-
53
-
54
-
55
-
56
-
57
-
58
-
59
-
60
-
61
-
62
-
63
-
64
-
65
-
66
-
67
-
68
-
69
-
70
-
71
-
72
-
73
-
74
-
75
-
76
-
77
-
78
-
79
-
80
-
81
-
82
-
83
-
84
-
85
-
86
-
87
-
88
-
89
-
90
-
91
-
92
-
93
-
94
-
95
-
96
-
97
-
98
-
99
-
100
-
101
-
102
-
103
-
104
-
105
-
106
-
107
-
108
-
109
-
110
-
111
-
112
-
113
-
114
-
115
-
116
-
117
-
118
-
119
-
120
-
121
-
122
-
123
-
124
-
125
-
126
-
127
-
128
-
129
-
130
-
131
-
132
-
133
-
134
-
135
-
136
-
137
-
138
-
139
-
140
-
141
-
142
-
143
-
144
-
145
-
146
-
147
-
148
-
149
-
150
-
151
-
152
 |
 |

37Experian Annual Report 2009
Introduction
2 – 7
Business review
Financial review
Governance
44 – 72
Financial statements
73 – 148
37
Discontinuing activities:
Experian
denes discontinuing activities as
businesses sold, closed or identied
for closure during a nancial year.
These are treated as discontinuing
activities for both revenue and EBIT
purposes. Prior periods, where shown,
are restated to disclose separately
the results of discontinuing activities.
This nancial measure differs
from the denition of discontinued
operations set out in IFRS 5, under
which a discontinued operation is a
component of an entity that has either
been disposed of, or is classied as
held for sale, and is: (i) a separate major
line of business or geographical area of
operations; (ii) part of a single plan to
dispose of a major line of business or
geographical area of operations; or (iii)
a subsidiary acquired exclusively with a
view to resale.
Continuing activities:
Businesses
trading at 31 March 2009 that have
not been disclosed as discontinuing
activities are treated as continuing
activities.
Organic growth:
This is the year-on-
year change in continuing activities
revenue, at constant exchange rates,
excluding acquisitions (other than
afliate credit bureaux) until the rst
anniversary date of consolidation.
Direct business:
Direct business
refers to Experian’s business exclusive
of the nancial results of associates
(including FARES).
Constant exchange rates:
In order to
illustrate its organic performance,
Experian discusses its results in
terms of constant exchange rate
growth, unless otherwise stated. This
represents growth calculated as if the
exchange rates used to determine the
results had remained unchanged from
those used in the previous year.
Free cash ow:
Free cash ow is
derived from operating cash ow by
excluding net interest and tax paid
together with dividends paid to minority
shareholders.
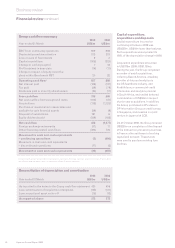
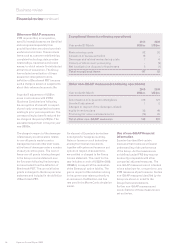
Reconciliation of revenue and EBIT by principal activity
To t a l Organic
2009 2008 growth1 growth1
Year ended 31 March US$m US$m % %
Revenue
Credit Services2 1,614 1,546 10 1
Decision Analytics2 487 505 6 5
Marketing Services2 770 781 5 –
Interactive2 950 880 10 10
Total – continuing activities 3,821 3,712 8 3
Discontinuing activities3 52 77 n/a
Total 3,873 3,789 8
EBIT
Credit Services – direct business2 506 484 9
FARES 48 54 (11)
Total Credit Services 554 538 7
Decision Analytics2 142 160 –
Marketing Services2 88 69 34
Interactive2 212 192 11
Central Activities (57) (57) n/a
Total – continuing activities 939 902 8
Discontinuing activities3 – 6 n/a
Total 939 908 8
EBIT margin4
Credit Services – direct business 31.4% 31.3%
Decision Analytics 29.2% 31.7%
Marketing Services 11.4% 8.8%
Interactive 22.3% 21.8%
Total EBIT margin4 23.3% 22.8%
1 Growth at constant exchange rates
2 2008 restated for reclassication of certain businesses between segments
3 Discontinuing activities include UK account processing, Loyalty Solutions and other smaller discounting activities
4 EBIT margin is for continuing direct business only, excluding FARES
Roundings
Certain nancial data have been
rounded within this report. As a result
of this rounding, the totals of data
presented may vary slightly from the
actual arithmetic totals of such data.
Comparative nancial
information
As a consequence of the disposal of
the Group’s transaction processing
activities in France in October 2008,
those activities are now classied as
discontinued in accordance with the
denition of discontinued operations
set out in IFRS 5 ‘Non-current assets
held for sale and discontinued
operations’ and the comparative
information given within this report has
been restated as appropriate.