Experian 2009 Annual Report Download - page 34
Download and view the complete annual report
Please find page 34 of the 2009 Experian annual report below. You can navigate through the pages in the report by either clicking on the pages listed below, or by using the keyword search tool below to find specific information within the annual report.-
 1
1 -
2
-
3
-
4
-
5
-
6
-
7
-
8
-
9
-
10
-
11
-
12
-
13
-
14
-
15
-
16
-
17
-
18
-
19
-
20
-
21
-
22
-
23
-
 24
24 -
 25
25 -
 26
26 -
 27
27 -
 28
28 -
 29
29 -
 30
30 -
 31
31 -
 32
32 -
 33
33 -
 34
34 -
 35
35 -
 36
36 -
 37
37 -
 38
38 -
 39
39 -
 40
40 -
 41
41 -
 42
42 -
 43
43 -
 44
44 -
45
-
46
-
47
-
48
-
49
-
50
-
51
-
52
-
53
-
54
-
55
-
56
-
57
-
58
-
59
-
60
-
61
-
62
-
63
-
64
-
65
-
66
-
67
-
68
-
69
-
70
-
71
-
72
-
73
-
74
-
75
-
76
-
77
-
78
-
79
-
80
-
81
-
82
-
83
-
84
-
85
-
86
-
87
-
88
-
89
-
90
-
91
-
92
-
93
-
94
-
95
-
96
-
97
-
98
-
99
-
100
-
101
-
102
-
103
-
104
-
105
-
106
-
107
-
108
-
109
-
110
-
111
-
112
-
113
-
114
-
115
-
116
-
117
-
118
-
119
-
120
-
121
-
122
-
123
-
124
-
125
-
126
-
127
-
128
-
129
-
130
-
131
-
132
-
133
-
134
-
135
-
136
-
137
-
138
-
139
-
140
-
141
-
142
-
143
-
144
-
145
-
146
-
147
-
148
-
149
-
150
-
151
-
152
 |
 |

32 Experian Annual Report 2009
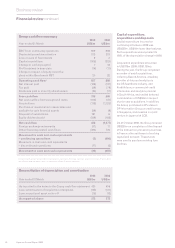
Group cash ow summary
2009 2008
Year ended 31 March US$m US$m
EBIT from continuing operations 939 908
Depreciation and amortisation 273 273
Loss on sale of xed assets 9 3
Capital expenditure (305) (321)
Change in working capital 7 18
Prot retained in associate (16) (17)
Charge in respect of equity incentive
plans within Benchmark PBT 20 22
Operating cash ow1 927 886
Net interest paid (128) (131)
Tax paid (39) (79)
Dividends paid to minority shareholders (24) (11)
Free cash ow 736 665
Net cash outow from exceptional items (102) (37)
Acquisitions (179) (1,720)
Purchase of investments in associates and
available for sale nancial assets (29) (9)
Disposal of subsidiaries 191 6
Equity dividends paid (189) (182)
Net cash ow 428 (1,277)
Foreign exchange movements (37) 17
Other nancing related cash ows (394) 776
Movement in cash and cash equivalents
– continuing operations (3) (484)
Movement in cash and cash equivalents
– discontinued operations (17) (3)
Movement in cash and cash equivalents (20) (487)
1 A reconciliation of cash generated from operations as reported in the Group cash ow statement on page 77 to operating
cash ow as reported above is given in note 32 to the Group nancial statements
Reconciliation of depreciation and amortisation
2009 2008
Year ended 31 March US$m US$m
As reported in the notes to the Group cash ow statement 420 406
Less: amortisation of acquisition intangibles (132) (121)
Less: exceptional asset write-off (15) (12)
As reported above 273 273
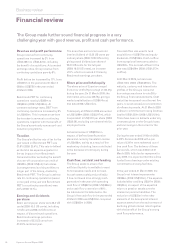
Business review
Financial review continued
Capital expenditure,
acquisitions and disposals
Capital expenditure incurred on
continuing activities in 2009 was
US$305m, US$16m lower than last year.
Such expenditure was equivalent to
108% of the depreciation charge in 2009.
Acquisition expenditure amounted
to US$179m (2008: US$1,720m).
During the year, the Group completed
a number of small acquisitions,
including Search
America
, a leading
provider of data and analytics to
the US healthcare industry, and
KreditInform, a commercial credit
information and analytics provider
in South Africa, and settled deferred
consideration of US$59m in respect
of prior year acquisitions. In addition,
the Group purchased a 40% stake in
DP Information Group, a credit bureau
in Singapore, and invested in a joint
venture in Japan with CCB.
On 31 October 2008, the Group received
US$203m on completion of the disposal
of the transaction processing business
in France, after settlement of working
capital and net debt. These funds
were used to pay down existing loan
facilities.